Plotting Graphs
- Updated2025-04-07
- 2 minute(s) read
Plotting Graphs
Select Graphics tab to view and save graphical representations of the waveform that you have set up. The typical graphics setup is as shown in the following figure.
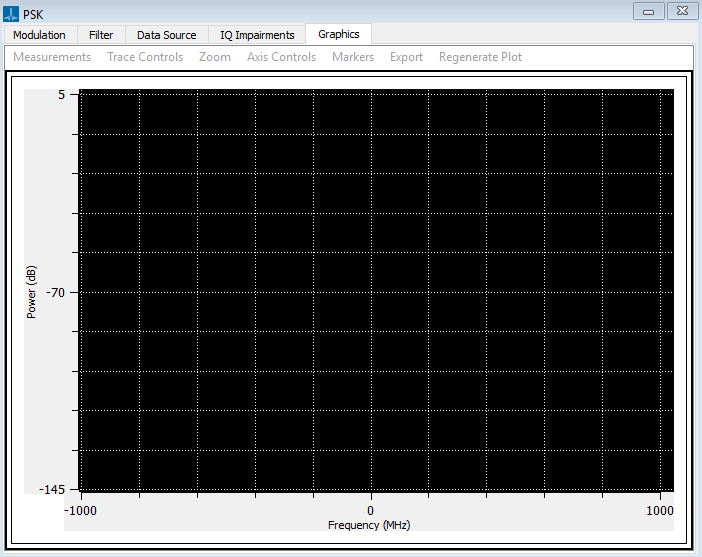
The Measurements menu allows you to select different types of plots. For example, if you want to view a spectrum of the waveform you are creating, choose the IQ FFT plot.
To generate graphics data, click Regenerate Plot on the top menu bar. This will generate the file and display the data in the graphics plot. After you have generated graphics data, you can regenerate at any time, by clicking on this option. You can save or print the resulting plot if required. An example vector plot of a 16 QAM signal is shown in the following figure. You are able to zoom and set up markers.

Trace Controls
This sub-menu enables you to turn on and off different traces in the graph independently. This option is only available if there are more than one independent trace running for the given graph, for example, I and Q traces.

Axis Controls
The Axis Control drop-down menu allows you to change the units of the X or Y axis only for time or frequency. Depending on the type of graph, the Frequency and Time options are available in the Axis Control drop-down menu.
The Frequency menu will allow you to change the axis units to Hz, kHz, MHz, GHz, or THz.
The Time menu will allow you to change the axis units to s, ms, us, or ns.
You can select Auto to automatically select the appropriate axis scaling for the given graph.
Export
Once trace data has been created, there are several ways of exporting information about the trace for use outside RFmx Waveform Creator. The supported export features are as follows:
Print: Print the complete trace including axis marker read-out to any printer currently accessible to windows.
Copy Image to Clipboard: Copies the complete trace, including axis and marker read-out to the windows clipboard, which can then be used to paste the bitmap into other applications.
Export as Bitmap: Export the complete trace, including axis and marker read-out to a bitmap. Selecting this option will prompt you to select a file.