GenLSFit
- Updated2023-02-21
- 9 minute(s) read
Advanced Analysis Library Only
AnalysisLibErrType GenLSFit (void *hMatrix, ssize_t numberOfRows, ssize_t numberOfColumns, double yArray[], double standardDeviation[], int algorithm, double zArray[], double coefficientArray[], void *covariance, double *meanSquaredError);
Purpose
Finds the best fit k-dimensional plane and the set of linear coefficients using the least chi-squares method for observation data sets.

| where | i = 0, 1, . . ., n – 1 |
| n = the number of your observation data sets |
You can use GenLSFit to solve multiple linear regression problems and to solve for the linear coefficients in a multiple-function equation.
The general least squares linear fit problem can be described as follows. Given a set of observation data, find a set of coefficients that fit the linear model:

[Equation 1]
| where | b is the set of coefficients |
| n is the number of elements in YArray and the number of rows of HMatrix | |
| k is the number of elements in coefficientArray | |
| xij is the observation data, which HMatrix contains |

You can write Equation 1 as Y = HB.
The previous discussion leads to a multiple linear regression model, which uses several variables:
xi0, xi1, ..., xik – 1
to predict one variable yi. In contrast, LinearFitEx, ExpFitEx, and PolyFitEx are all based on a single predictor variable, which uses one variable to predict another variable.
In most cases, we have more observation data than coefficients. The formulas in Equation 1 might not produce the solution. The fit problem becomes to find the coefficients B that minimize the difference between the observed data, yi, and the predicted value:

GenLSFit uses the least chi-squares plane method to obtain the coefficients in Equation 1, that is, finding the solution, B, which minimizes the following quantity:

[Equation 2]
where 
In the previous equation, σi is the standard deviation, stdDeviation. If the measurement errors are independent and normally distributed with constant standard deviation σi = σ, the previous equation is also the least squares estimation.
There are different ways to minimize χ2. One way to minimize χ2 is to set the partial derivatives of χ2 to zero with respect to b0, b1, ..., bk – 1:

The previous equations can be written as

 is the transposition of H0.
The previous equation and Equation 2 are also called normal equations of the least squares problems. You can solve them using LU or Cholesky factorization algorithms, but the solution from the normal equations is susceptible to round-off error.
The preferred way to minimize χ2 is to find the least squares solution of the equations:
H0B = Y0
You can use QR or Singular Value Decomposition factorization to find the solution, B. For QR factorization, you can choose Householder, Givens, or Givens2, also called fast Givens.
Different algorithms can give you different precision. In some cases, if one algorithm cannot solve the equation, perhaps another algorithm can. You can try different algorithms to find the one best suited to your data.
GenLSFit calculates the covariance matrix covariance as follows:

The best fitted curve z is given by the following formula:

GenLSFit obtains the mean squared error using the following formula:

You can think of the polynomial fit that has a single predictor variable as a special case of multiple regression. If the observation data sets are (xi, yi) where i = 0, 1, . . ., n – 1, the model for polynomial fit is as follows:

[Equation 3]
where i = 0, 1, 2, . . ., n – 1
Comparing Equation 1 and the Equation 3 shows that  . In other words:

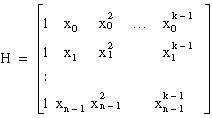
In this case, you can build HMatrix as follows:

Instead of using  , you can choose another function formula to fit the data sets (xi, yi). In general, you can select xij = fj(xi). Here, fj(xi) is the function model that you choose to fit your observation data. In polynomial fit,
  .
.
In general, you can build HMatrix as follows:

Your fit model is
yi = b0f0(x) + b1f1(x) + ... + bk – 1fk – 1(x)
The following two examples show how to use GenLSFit. The first example uses the function to perform multiple regression analysis based entirely on tabulated observation data. The second solves for the linear coefficients in a multiple-function equation.
Predicting Cost
Suppose you want to estimate the total cost, in dollars, of a production of baked scones using the quantity produced, X1, and the price of one pound of flour, X2. To keep things simple, the following five data points form the sample data table shown in the following table.
| Cost (dollars) Y | Quantity X1 | Flour Price X2 |
|---|---|---|
| $150 | 295 | $3.00 |
| $75 | 100 | $3.20 |
| $120 | 200 | $3.10 |
| $300 | 700 | $2.80 |
| $50 | 60 | $2.50 |
You want to estimate the coefficients to the following formula:
Y = b0 + b1X1 + b2X2
The only parameters you must build are the H (observation matrix) and y arrays. Each column of H is the observed data for each independent variable: The first column is one because the coefficient b0 is not associated with any independent variable. Fill in H as follows:

The following code is based on this example.
// Example of predicting cost using GenLSFit
int k, n, algorithm, status;
double H[5][3], y[5], z[5], b[3], X1[5], X2[5], mse;
double *stdDev=0, *covar=0; /* Define empty arrays; the function will
ignore these parameters. */
n = 5;
k = 3;
// Read in data for X1, X2, and y.
.
.
.
// Construct matrix H.
for(i=0;i<n;i++) {
H[i][0] = 1; // Fill in the first column of H.
H[i][1] = X1[i]; // Fill in the second column of H.
H[i][2] = X2[i]; // Fill in the third column of H.
}
algorithm = 0; // Use SVD algorithm.
status = GenLSFit (H, n, k, y, stdDev, algorithm, z, b, covar, &mse);
Linear Combinations
Suppose that you have samples from a transducer, y values, and you want to solve for the coefficients of the model:
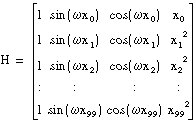
y = b0 + b1sin(ωx) + b2cos(ωx) + b3x3
To build H, set each column to the independent functions evaluated at each x value. Assuming there are 100 x values, H would be the following array:

The following code is based on this example.
// Example of linear combinations using GenLSFit
int i, k, n, algorithm, status;
double H[100][4], y[100], z[100], b[4], x[100], mse, w;
double *stdDev=0, *covar=0; /* Define empty arrays, the function will
ignore these parameters.*/
n = 100;
k = 4;
w = 0.2;
// Read in data for x and y.
.
.
.
// Construct matrix H.
for(i=0;i<n;i++) {
H[i][0] = 1; // Fill in the first column of H.
H[i][1] = sin(w*x[i]); // Fill in the second column of H.
H[i][2] = cos(w*x[i]); // Fill in the third column of H.
H[i][3] = pow(x[i],3); // Fill in the fourth column of H.
}
algorithm = 0; // Use SVD algorithm.
status = GenLSFit (H, n, k, y, stdDev, algorithm, z, b, covar, &mse);
Parameters
| Input | ||
| Name | Type | Description |
| hMatrix | void * | An n-by-k matrix that contains the observation data (xi0, xi1, ..., xik – 1) for i = 0, 1, . . ., n – 1, where n is the number of rows in HMatrix, k is the number of columns in HMatrix. This matrix must be an array of doubles. |
| numberOfRows | ssize_t | Number of rows in HMatrix and the number of elements in YArray. |
| numberOfColumns | ssize_t | Number of columns of HMatrix and the number of elements in coefficientArray. |
| yArray | double [] | An array whose elements contain the y coordinates of the data sets to be fitted. The number of elements in YArray must equal the number of rows in HMatrix. |
| standardDeviation | double [] | Standard deviation δi for data point (xi, yi). If the standard deviations are equal or if you do not know the standard deviation, pass NULL, and GenLSFit ignores this parameter. The size of this array should equal numberOfRows. If any standard deviation is 0, this function will return a singular matrix error. |
| algorithm | int | Algorithm used to solve the multiple linear regression model. The algorithm has the following possible values.
|
| Output | ||
| Name | Type | Description |
| zArray | double [] | The best fitted curve. The size of this array must equal at least numberOfRows. |
| coefficientArray | double [] | Set of coefficients that best fit the multiple linear regression model in a least squares sense. |
| covariance | void | Matrix of covariances with k-by-k elements. cj, k is the covariance between bj and bk, and cj, j is the variance of bj. If you pass an empty array for covariance, GenLSFit does not calculate this matrix. |
| meanSquaredError | double | The mean squared error generated by the difference between the fitted curve and the raw data. |
Return Value
| Name | Type | Description |
| status | AnalysisLibErrType | A value that specifies the type of error that occurred. Refer to analysis.h for definitions of these constants. |
Additional Information
Library: Advanced Analysis Library
Include file: analysis.h
LabWindows/CVI compatibility: LabWindows/CVI 4.0 and later