Selecting Switch Bandwidth
Overview
Contents
- Introduction
- Ideal Square Wave
- Rise Time Bandwidth Approximation
- System Response
- Switch Selection Example
- Signal, Switch, and System Bandwidth Relationship
- Summary
Introduction
When selecting a switch for test and measurement applications, it is important to understand what bandwidth ratings mean for switches. Most switches are rated by insertion loss at a specific frequency, but how you apply these values may not always be obvious.
If your input signal is purely sinusoidal, the bandwidth/insertion loss rating is directly applicable. For example, a switch with a bandwidth rating of 10 MHz implies that the switch has an insertion loss of -3 dB at 10 MHz. If the input signal is a 10 MHz, 1V peak-to-peak sine wave, the output signal will be a 10 MHz, 0.7 V peak-to-peak sine wave.
If the input signal is not purely sinusoidal and has multiple frequency components (like a square wave), applying the ratings can be a little more troublesome. For example, a square wave can have its fundamental frequency below the bandwidth rating while some of the harmonics are above the rating. These harmonics would be attenuated to a higher degree.
This first section describes how harmonics are attenuated and how to apply bandwidth rating to a square wave. The second section discusses the concept of a system rise time and switch selection.
Ideal Square Wave
A classic example of a signal with multiple frequency components is an ideal square wave. (refer to Figure 1.) Consider a 2 V peak-to-peak square wave with a fundamental frequency of 1 Hz. The frequency components that make up the square wave are infinite. It is made up of the summation of weighted harmonics.
Equation (1) shows this summation.
For square waves, only odd harmonic terms are used, (e.g. sin t, sin 3t, sin 5t, etc), where the frequency is in radians per second.
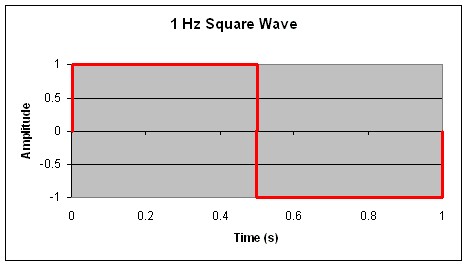
Figure 1.
Using Equation (1), we can graph the summation of several harmonics. Figure 2 shows this square wave approximated by the summation of different harmonic sine waves: fundamental frequency or 1st harmonics, summation of the 1st, 3rd, and the 5th harmonics and summation from the 1st to the 13th harmonics.
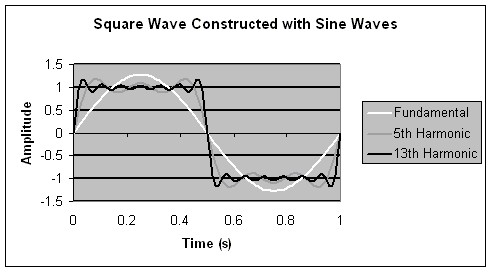
Figure 2.
Once the 5th or 7th harmonic is reached, there is little change in the slope of the edges. For signals like square waves, where the frequency content is known, the switch bandwidth should be based on the highest harmonic passed with minimal attenuation or distortion. If the selection of the switch is based upon the 7th harmonic of the ideal 1 Hz square wave, a switch with a -3 dB point at 7 Hz can be used.
As a rule of thumb, choose a switch for a square wave equal to 7 times the fundamental frequency.
Rise Time Bandwidth Approximation
For other signals where the frequency components are not known, the bandwidth may be approximated using rise time. The rise time is related to the -3 dB point by the approximation:
Where tr is the time the signal takes to go from 10% to 90% of its amplitude. See Figure 3.
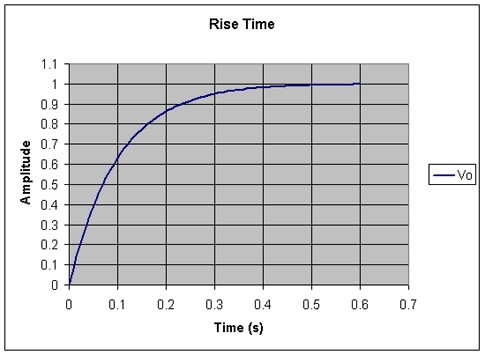
Figure 3
For the signal shown in Figure 3, the rise time is about 0.22 seconds.
To illustrate this approximation, consider the signal shown in Figure 4.
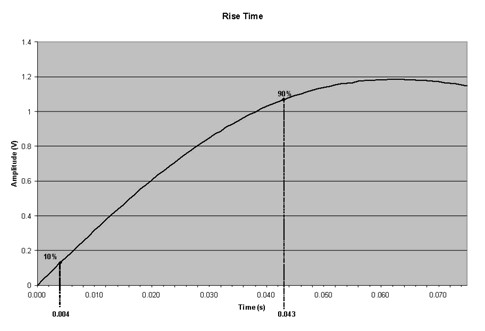
Figure 4
The rise time from 10% to 90% of the amplitude of this signal is 0.039 s. The -3 dB point can then be approximated as 8.97 Hz. Figure 3 is a graph of the summation of the 1st, 3rd, 5th, and 7th harmonics of the 1 Hz ideal square wave shown in Figure 1.
System Response
A signal passing through a switch is modified. The extent of this modification or filtering depends on the combined response of the signal and the switch. Using the rise time from 10% to 90% of the signal amplitude, the system response can be stated in the following equation:
(3)
Where Tsys, Tsig and Tsw are the rise times of the system, signal, and switch respectively.
To minimize the effect of the switch on the signal, the switch bandwidth should be much higher (i.e. have a shorter rise time) than the signal bandwidth.
Switch Selection Example
Consider a signal rise time of Tsig = 9 ns.
Find a switch bandwidth where only a 2 % increase of the signal rise time occurs.
A 2% increase in rise time results in a system rise time of:
Using Equation (3), the switch rise time be calculated
Using Equation (2), the -3 dB point can be approximated:
Selecting a switch with a -3 dB bandwidth of 193 MHz will allow only a 2% increase in the signal rise time.
Signal, Switch, and System Bandwidth Relationship
In a more general way, the system bandwidth can be expressed using the allowed reduction in input signal bandwidth (p):
Using Equation (2) and (3) we can relate the bandwidth:
Substituting Bsys from Equation (4) into Equation (5), the switch bandwidth becomes:
Figure 4 is the graphical representation of this relationship.
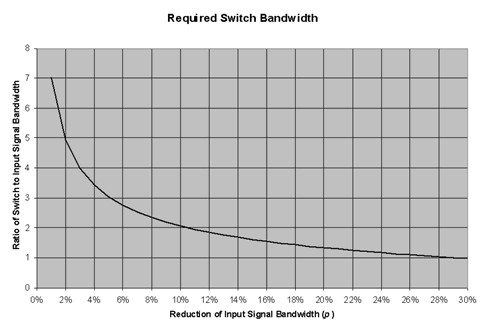 Figure 5
For this example, only the attenuation due to switch bandwidth has been considered. Effects due to impedance mismatch are not covered here.
From our example the input signal has a -3 dB bandwidth of:
From the graph on Figure 5, to allow for a 2% reduction of input signal bandwidth, we need to select a switch with a bandwidth 5 times the bandwidth of the input signal: 194 MHz.
Summary
When selecting a switch for your application, you should consider the bandwidth rating which usually this rating corresponds to the -3 dB attenuation point. Knowing the highest frequency that must pass through a switch with minimal attenuation is very important.
For a simple sine wave input signal, the switch bandwidth rating is directly applicable. For square wave input signals, additional components of the signal must be considered. For a given fundamental frequency, select a switch with a -3 dB frequency seven times greater that the fundamental frequency. For other input signals, use the rise time approximation explained in this document.
If an attenuation less than -3 dB is required, select a switch with a higher bandwidth rating.


