What is Availability?
Overview
The acronym “RASM” encompasses four separate but related characteristics of a functioning system: reliability, availability, serviceability, and manageability. IBM is commonly noted [1] as one of the first users of the acronym “RAS” (reliability, availability, and serviceability) in the early data processing machinery industry to describe the robustness of its products. The “M” was recently added to RASM to highlight the key role “manageability” plays in supporting system robustness by facilitating many dimensions of reliability, availability, and serviceability. RASM features can contribute significantly to the mission of systems for test, measurement, control, and experimentation as well as their associated business goals.
Contents
- Approaches to Preventing Downtime
- Definition of Availability
- Availability for Each Phase of Life
- Phase 1: Pre-Life
- Phase 2: Early Life
- Phase 3: Useful Life
- Phase 4: Wear Out
- Summary
- Additional Resources
Approaches to Preventing Downtime
In today’s ever more challenging economy, companies need to be as efficient as possible with their assets. Assets such as automated test systems, data acquisition systems, control systems, and so on are required to be in service as much as possible. Thus, downtime is becoming more and more costly. With the complexity of computer-based systems growing at the rate approximating Moore’s law, additional capabilities can lead to greater threats to system reliability, which results in more opportunity for failure and downtime. The premise that systems should not or will not fail is a noble goal, but many times it’s simply not realistic. Therefore, careful attention must be paid to measuring utilization and ensuring the required availability for the mission. Measuring utilization is a common way to assess the return on investment of a complex computer-based system. Utilization in its simplest form is a measure of the time the system is used divided by the time used and the time not used (for any reason).
And availability in its simplest form is the measure of uptime (the amount of time the system is performing its mission) divided by the uptime plus downtime (the amount of time the system is not performing its mission):
[2]
This ratio, convertible to a percentage, is the probability that the system is “available” for service when it is needed. Therefore, availability is the probability that the system can perform its mission when needed. Note that even with 100 percent availability, 100 percent utilization may not be achievable. This is due to downtime, which could be attributed to a lack of demand, poor planning for demand, lack of operator skills, and so on. Many enterprises seek to operate their systems around the clock (24/7/365), striving for maximum utilization to make the most of their investment. In addition, availability has risen to prominence over the past several decades in industries such as telecommunications, information technologies, and manufacturing as a key measure of a system’s quality.
This paper addresses the basic concepts of availability in the context of downtime avoidance.
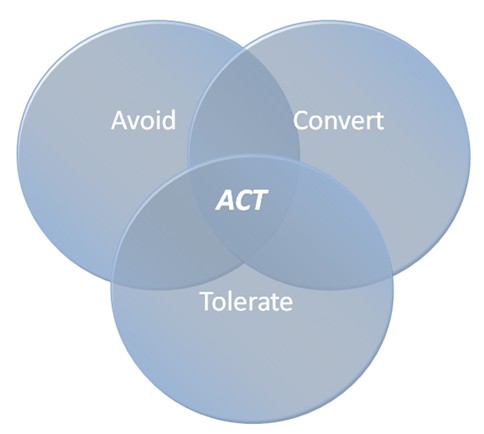
The acronym ACT represents three basic approaches to preventing downtime:
1) Avoid downtime with rigorous and high-quality design, planning, procurement, and manufacturing
2) Convert downtime from an unplanned outage to a planned outage using aggressive predictive failure analysis and preventive maintenance
3) Tolerate the failure of a component by including another redundant fail-over component in the system or by other means such as automatic error correction
Figure 1. Diagram Depicting the Interrelationship of the ACT Approaches
Definition of Availability
There are many definitions for availability, but all contain the probability of a system operating as required when required.
Hence, availability is the probability that a system will be available to preform its function when called upon.
The "Nines" of Availability
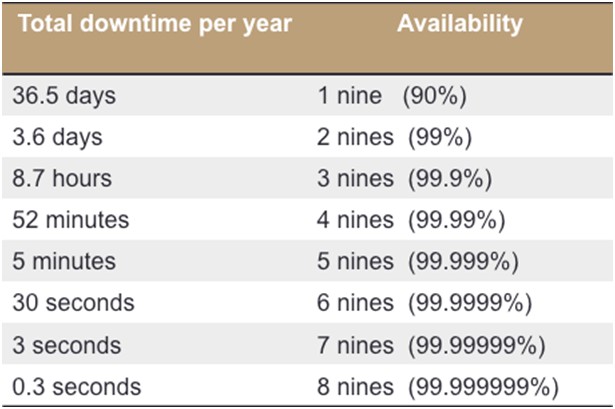
In high-demand applications that are commonly in service 24/7, the availability is frequently measured by the number of “nines.” If availability is 99.0 percent, it is stated to be “2 nines,” and if it is 99.9 percent, it is called “3 nines,” and so on. Figure 2 depicts the amount of downtime a system exhibits within one year (365 days) of continuous (24/7) desired operation and its associated number of nines, which are calculated using this formula:
Figure 2. Downtime Allowed for 24/7/365 Usage Profile per Nines of Availability
Achieving greater than 4 nines of availability is a challenging task that often requires critical system components that are redundant and hot-swappable. Note that hot-swappable components can help reduce the time to repair a system, or mean time to repair (MTTR), which enhances serviceability. And reduced service time increases the availability. This is one way availability and serviceability are related.
Availability for Each Phase of Life
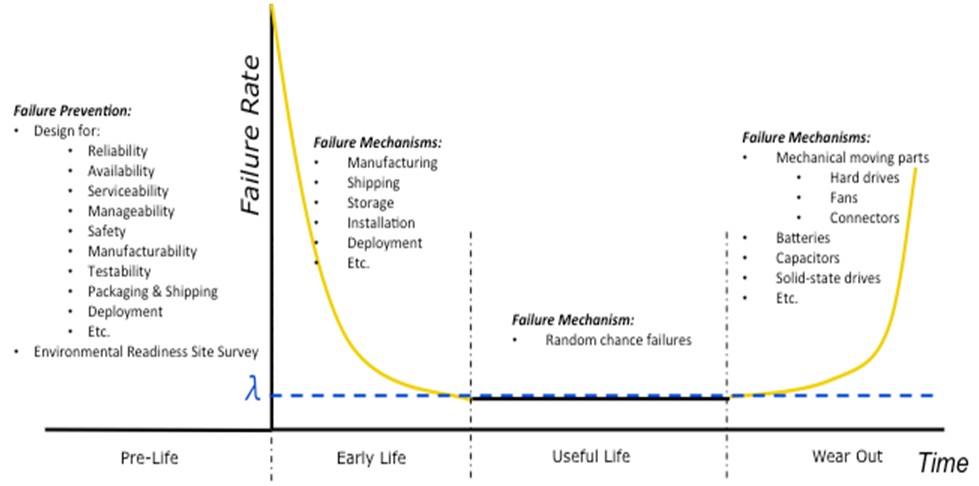
Consider the bathtub curve in Figure 3. This curve, named for its shape, depicts the failure rate over time of a system or product. A product’s life can be divided into four phases: Pre-Life, Early Life, Useful Life, and Wear Out. Each phase requires making different considerations to help avoid a failure at a critical or unexpected time because each phase is dominated by different concerns and failure mechanisms. Figure 3 includes some of these failure mechanisms.
Figure 3. Bathtub Curve
Phase 1: Pre-Life
“Every battle is won before it is ever fought.”
–Sun Tzu
The focus during Pre-Life is planning and design. The design and planning phase of a system can have a great impact on its availability. But to design appropriately, you must first understand the level of availability a system needs.
Consider the following major factors when determining availability needs. These are only some of the considerations you need to make.
Cost of downtime: This is the most fundamental question you must understand. This information should help drive how much you spend on the system or how much availability you can afford to have. The cost of downtime should include the cost of lost production/sales and the cost of employees/customers not able to do their work.
Redundant component requirements: Replicating critical or “high probability of failure” components in a system is one way to achieve higher availability. This adds cost, which at first glance reduces the return on investment of a system. However, General Electric states [3] the average cost of outage for a consumer electronics manufacturer can be as high as $100,000 per outage. Thus avoiding even a single outage can save significant money, part of which could be used to pay for redundant components.
Sparing strategy: Keeping spare parts nearby to quickly replace failed components reduces the MTTR and, therefore, increases availability. Spare parts do add to the cost of the overall solution, but waiting and ordering parts at the time of their failure results in the system being unavailable during the time it takes to deliver the parts. This reduced availability adds to the cost incurred by downtime, and can outweigh the cost of keeping spare parts in inventory and readily accessible.
Diagnostic tool requirements: Identifying the failed component(s) is crucial to making the repair. Thus it is desirable to quickly and accurately diagnose, or even predict, a failure. You can achieve this with effective manageability features. Good manageability can lead to faster serviceability and, hence, higher availability. This is one way manageability, serviceability, and availability are related.
Learn more about manageability
Operation and service skills: Similar to the availability of spare parts, the availability of skilled personnel to diagnose and service the repair contributes to availability. In addition, personnel to conduct preventive maintenance is another key to high availability.
Environmental factors: The environment in which the system operates can have a great impact on its availability. For example, when can you access the system? If the system is used to acquire data in a hostile environment, it may be unsafe for personnel to access until the surrounding areas are free from hazards. This can cause significant delays in MTTR. Other unfriendly environmental factors such as unstable power, dust, vibration, or high traffic areas can affect the system’s proper operation. Conducting an Environmental Readiness Site Survey (ERSS) before system installation and deployment is an effective way to evaluate many of these factors, and it can help you understand how the environment can affect the required availability.
Phase 2: Early Life
Early Life is typically characterized by a failure rate higher than that seen in the Useful Life phase. These failures are commonly referred to as “infant mortality.” Such early failures can be accelerated and exposed by a process called Burn In, which is typically implemented before system deployment. This higher failure rate is often attributed to manufacturing flaws, bad components not found during manufacturing test, or damage during shipping, storage, or installation. The failure rate rapidly decreases as these issues are worked out.
Early Life failures can often be very frustrating, time consuming, and expensive, leaving a poor first impression of the system’s quality. Thus, before the completion of deployment and “going live” with a production system, you should test it in its actual target environment under the intended production usage profile first. This Early Life testing is basically testing to ensure there are no damaged products. Although vendor manufacturing conducts final verification testing on each product before shipment, it cannot conduct final verification testing on products after shipment or on each complete system in the production environment. In addition to potential manufacturing errors not covered by manufacturing test, products can be damaged in shipment, storage, installation, or deployment.
Phase 3: Useful Life
Useful Life is when the system’s Early Life issues are all worked out and it is trusted to perform its intended and steady-state operation. Two types of maintenance, corrective maintenance (CM) and preventive maintenance (PM), are key to increasing availability during Useful Life.
CM, driven by the steady-state failure rate, includes all the actions taken to repair a failed system and get it back into an operating or available state. As stated earlier, MTTR is crucial to effective CM. PM includes all the actions taken to replace or service the system to retain its operational or available state and prevent system failures. PM is measured by the time it takes to conduct routine scheduled maintenance and its specified frequency. Both CM and PM remove the system from its available state, thus reducing the availability, unless the critical components of the system are redundant and maintenance can be conducted without interrupting the service that the system is providing. Hot-swappable components facilitate this type of high-availability maintenance.
It is during the Useful Life phase that many of the rigorous scientific and mathematic concepts of RASM engineering are applied. In Useful Life, failures are considered to be “random chance failures,” and they typically yield a constant failure rate. This is fortunate because a constant failure rate simplifies the mathematics associated with predicting failures.
During Useful Life, you can calculate the mean time between failure (MTBF) with a constant failure rate, “λ,” as shown below:
[4]
Knowing the failure rate and MTBF, you can calculate three main types of availability:
Inherent Availability
Inherent availability ( ), the most commonly used measure, considers only CM for system failures and assumes steady-state conditions found during Useful Life with a constant failure rate. It does not account for any PM or planned downtime. is estimated as:
[5]
MTBF = Mean Time Between Failure
MTTR = Mean Time to Repair
Achieved Availability
Achieved availability () accounts for CM and PM. It is similar to inherent availability in that it assumes steady-state conditions found during Useful Life with a constant failure rate and a constant PM rate. This is sometimes referred to as the availability seen by the maintenance department. also assumes ideal situations for PM implementation such as the right tools for the job, adequately available and trained personnel, on-site spares, and so on. It does not account for other unforeseen circumstances. is estimated as:
[5]
MTBMA = Mean Time Between Maintenance (including CM and PM)
MMT = Mean Maintenance Time (including CM and PM)
[5]
= Failure Rate =
= Frequency of PM =
[5]
MTBF = Mean Time Between Failure
MTTR = Mean Time to Repair
MPMT = Mean Preventive Maintenance Time
Operational Availability
Operational availability ( ) is the measure of the actual system availability over a period of time in the real production environment. It accounts for all downtime, weather it is caused by CM, PM, administrative reasons, logistics, office parties, or bad weather. reflects real life because systems never break when it is convenient—it is always in the middle of the night before a holiday, when everyone is on lunch break, when the most knowledgeable person is on vacation, between shifts, when you are out of spares, or when the part you ordered got delayed because of bad weather at a major airport. is estimated as:
[5]
MDT = Mean Downtime = MMT + (logistical delays) + (administrative delays) + (etc.)
Phase 4: Wear Out
The Wear Out phase begins when the system’s failure rate starts to rise above the “norm” seen in the Useful Life phase. This increasing failure rate is due primarily to expected part wear out. Usually mechanical moving parts such as fans, hard drives, switches, and frequently used connectors are the first to fail. However, electrical components such as batteries, capacitors, and solid-state drives can be the first to fail as well. Most integrated circuits (ICs) and electronic components last about 20 years [6] under normal use within their specifications.
During the Wear Out phase of life, the reliability is compromised and difficult to predict. Predicting when and how systems will wear out is addressed in lots of reliability textbooks and considered by many to fall under the subject of either reliability engineering or durability. This information is valuable for developing preventive maintenance and replacement strategies as needed during Wear Out.
Summary
- Availability is the probability that a system will be available to perform its function when called upon.
- Availability is commonly measured by the “number of nines.”
- It is challenging to have more than 4 nines of availability without redundancy.
- The four phases of life for a system are Pre-Life, Early Life, Useful Life, and Wear Out.
- Pre-Life is focused on understanding the level of availability needed and planning for it.
- Understanding the cost of downtime is critical.
- An Environmental Readiness Site Survey (ERSS) is a powerful tool for understanding availability risks in the production environment.
- Early Life focuses on testing to ensure the system is ready to be commissioned into service.
- MTBF and MTTR can be used to predict both reliability and availability during Useful Life and, along with usage profiles, can help predict the number of spares needed.
- ACT depicts three basic ways to address the downtime that affects availability: 1) avoid downtime with rigorous and high-quality design, planning, procurement, and manufacturing; 2) convert downtime from an unplanned outage to a planned outage using aggressive predictive failure analysis and preventive maintenance; and 3) tolerate the failure of a component by including another redundant failover component in the system or by other means such as automatic error correction.
Additional Resources
View the entire RASM white paper series
[1] “Design and Evaluation,” 3rd ed., by Daniel P. Siewiorek and Robert S. Swarz, Reliable Computer Systems (A K Peters/CRC Press, 1998).
[2] “Reliability of Computer Systems and Networks,” by Martin L. Shooman, John Wiley & Sons, Inc., ISBN 0-471-29342-3, Chapter 1, Section 1.3.4, page 14.
[3] “High Availability for Non-Traditional Discrete and Process Applications,” GE Intelligent Platforms white paper (GFT-775).
[4] “Reliability Theory and Practice,” by Igor Bazovsky, Prentice-Hall, Inc. 1961, Library of Congress Catalog Card Number: 61-15632, Chapter 5, page 33.
[5] “Practical Reliability Engineering,” 5th ed., by Patrick D. O’Conner and Andre Kleyner, Wiley, ISBN 978-0-470-97981-5, Chapter 16, pages 409–410.
[6] Telcordia Technologies Special Report, SR-332, Issue1, May 2001, Section 2.4, pages 2–3.


