Block Diagrams
Contents
- Use Consistent Style and Placement of Terminal Labels. Justify Text Appropriately.
- Include Error Handling in All VIs
- Use the Appropriate Format String Modifiers to Configure a Period (.) as the Decimal Separator When Formatting or Parsing Numbers Sent to or Received From an Instrument
- Leave Enough Space Between Nodes on the Block Diagram. Do Not Overlap or Cover Objects on the Block Diagram.
- Set the Appropriate Level of Precision for Format Specifiers. Use the "%g" Format Specifier to Format and Parse Floating Point Numbers.
- Use a Select Function, Not a Case Structure, to Select Between Two Wire Options
- Save Diagrams with the First or Most Important Frames and Cases Visible
- Use the Concatenate Strings Function Sparingly and Only If You Cannot Find a More Appropriate String Function
- Design the Block Diagram so it Follows the Left-to-Right, Top-to-Bottom Model of Data Flow
- Use Dataflow and Direct Wire Connections to Specify the Execution Sequence
- Wire Block Diagram Objects Together as Neatly and Orderly as You Can
- Use Block Diagram Labels to Document Your Code
- Select the Following Options in the User Options Dialog. Ensure All VIs in Your API Have These Settings.
- Save the VI so the Block Diagram Opens in the Top Left Corner of the Screen When Opened. The Block Diagram Must Fit Within 1024x726 Resolution.
- Do Not Use Save Options That Remove or Password-Protect the Block Diagram
Use Consistent Style and Placement of Terminal Labels. Justify Text Appropriately.
Recommended
- Use plain text labels for controls/indicators.
- Make all control and indicator terminal labels visible on the block diagram.
- Use labels on block diagram constants to document the nature of the constants.
Labels on the block diagram improve the readability of your VIs, which allows users to customize the VIs more easily.
Include Error Handling in All VIs
- Do not change the error codes defined in the instrument driver templates.
- Include calls to the Error Query VI in all instrument driver API VIs. The only exceptions are low-level VIs used for end-user optimization.
- If you define an instrument specific error code, use a code in the range of -Â 1073999873 to -Â 1074001920 (Hex: 0xBFFC0800 to 0xBFFC0FFF)
- If you define an instrument specific warning, use a code in the range of 1073481728 to 1073483775 (Hex: 0x3FFC0800 to 0x3FFC0FFF)
- If you define an instrument specific error or warning code, pre-pend the tag to instrument error descriptions and wire to the Source of the error cluster.
Error codes defined within the instrument driver templates ensure consistent error codes in all instrument drivers.
Calling the Error Query VI within each API VI ensures the instrument driver checks the status of the instrument after each operation automatically. This helps users associate an instrument error with instrument commands within a particular instrument driver VI.
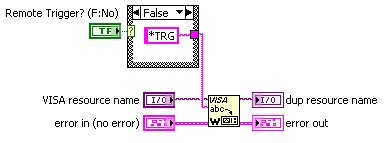
The block diagram in the figure below shows how an instrument driver VI calls the Error Query VI.
If you define additional error codes in your instrument driver, append the tag to your error description. This tag tells LabVIEW to use the information in the source text as the explanation for the associated error code. LabVIEW ignores any previously defined explanations in the LabVIEW error codes database. The Initialize Template VI uses this technique.
Use the Appropriate Format String Modifiers to Configure a Period (.) as the Decimal Separator When Formatting or Parsing Numbers Sent to or Received From an Instrument
- Include \"%.;\" as part of the format string to convert floating point numbers when using functions like Format Into String or Array to Spreadsheet String.
- Wire a False Constant from the Boolean palette to the Use System Decimal Point terminal of the Number To Exponential String and Number To Fractional String functions.
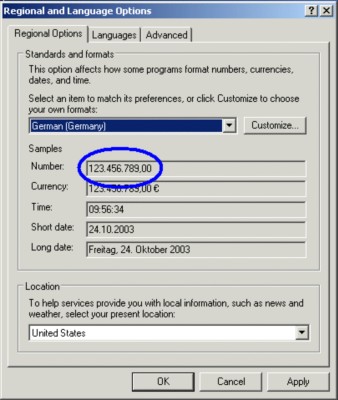
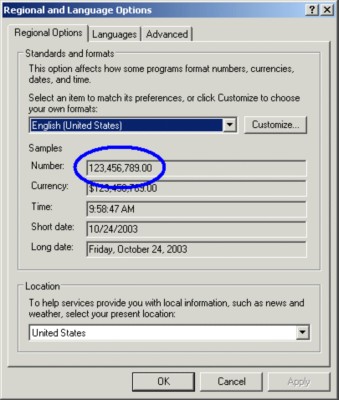
Number formats depend on regional preferences. However, instrument number formats do not. In the United States, the decimal point (.) separates the whole number from the fractional part of a number. In western Europe a comma (,) often separates the whole number from the fractional part of the number. Most user applications display and operate on double-precision data using the number format commonly used in the region. LabVIEW uses the system default settings for number formats. The figures below show how the Windows operating system displays German and U.S. numbers.
Instruments send and receive ASCII numbers using decimal points as separators, regardless of where you use the instrument and how you configure your computer. The user might configure LabVIEW to use the system default settings for number formats, so use the decimal point (.) as the separator for string parsing and formatting for instrument control strings.
For LabVIEW to use the decimal point separator of the operating system and communicate properly with instruments, all string operations that operate on floating point numbers must include the modifiers to use a period (.) as the decimal separator.
To force the decimal point, include the "%.;" in the format string input of Format Into String or Array to Spreadsheet String functions. To use the decimal specifier format string, attach %.; to the beginning of the standard format string input for floating point inputs (floats, exponential inputs), such as "%.; SHOR %e;". If you use the Number To Exponential String or Number To Fractional String functions, wire a False Constant from the Boolean palette to the Use System Decimal Point terminal. You do not need this decimal specifier for decimal numbers (those that use %d or %x format specifier).
Leave Enough Space Between Nodes on the Block Diagram. Do Not Overlap or Cover Objects on the Block Diagram.
Recommended
- Use the Size to Text to ensure all the text in a label appears regardless of font or language settings.
Fonts vary by platform, user system preferences, and video driver settings. Therefore, text might appear larger or smaller on different systems. Right-click the labels on the block diagram and select the Size to Text option to allow extra space for larger fonts.
Make all labels visible to help users understand the block diagram. Covered VIs, functions, wires and terminals make the block diagram difficult to understand. To prevent labels from overlapping block diagram nodes when the font size changes, include extra space between the nodes.
Set the Appropriate Level of Precision for Format Specifiers. Use the "%g" Format Specifier to Format and Parse Floating Point Numbers.
Recommended
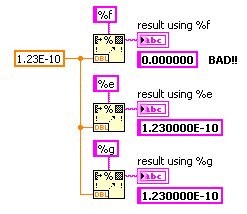
Many instruments accepts ASCII decimal numbers in a format referred to as Decimal Numeric Program Data or <NRf> for "flexible Numeric Representation". This format accepts values in both exponential and decimal format. For example, both of these numbers are valid: "+12.3e-10" or "0.000000000123". If you use "%f" when converting to a string, the value would be "0.00000".
Consider the range of values the instrument accepts for a given instrument setting and the number of digits of precision the instrument accepts. Use the "%g" format if the instrument accepts a value with a large range of values. This format allows the number of digits of precision to change based on the exponent and precision of the number. LabVIEW uses an "f" if the exponent is greater than -4 or less than the precision specified. LabVIEW uses an "e" if the exponent is less than -4 or greater than the precision specified.
The figure below shows how format specifiers affect a value you might send to an instrument.
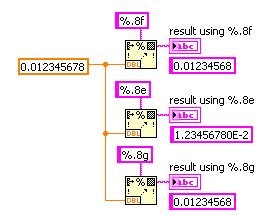
For high precision settings, specify an appropriate value of precision in the format string. If the instrument accepts more than 5 digits of precision, include a precision specifier in the format string. The VI in the figure below uses precision settings in the format specifier to affect a value you might send an instrument.
Use a Select Function, Not a Case Structure, to Select Between Two Wire Options
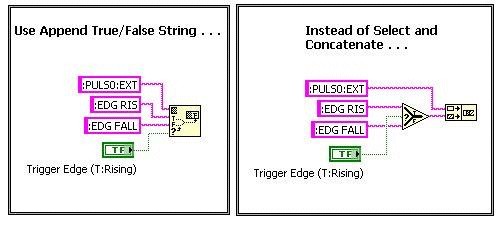
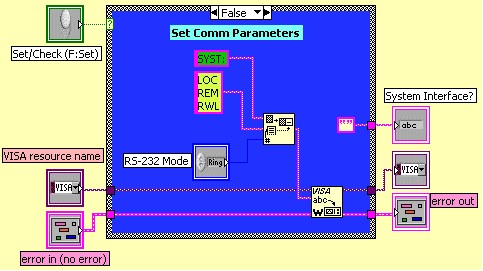
Users better understand diagrams that do not hide code within structures. When selecting between two wire options, use the Select function because it does not hide code, unlike the Case Structure structure. The VIs in the figures below show how the readability of the block diagram improves when you use a Select function. The two string constant choices are obvious and the users does not need to scroll through cases.
Save Diagrams with the First or Most Important Frames and Cases Visible
Recommended
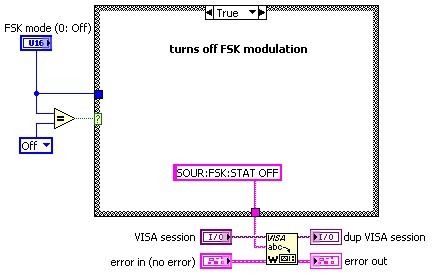
Often a Case Structure includes a case with little or no functionality. However this case is not very informative to the user. Therefore, to minimize customer need to change the visible cases, save the VI so Case Structures display the most important cases first when the user opens the block diagram. If all cases are equally important, save the diagram with the first or True case visible.
The VIs in the figures below show how the readability of a block diagram improves when you display the most important cases.
Use the Concatenate Strings Function Sparingly and Only If You Cannot Find a More Appropriate String Function
Recommended
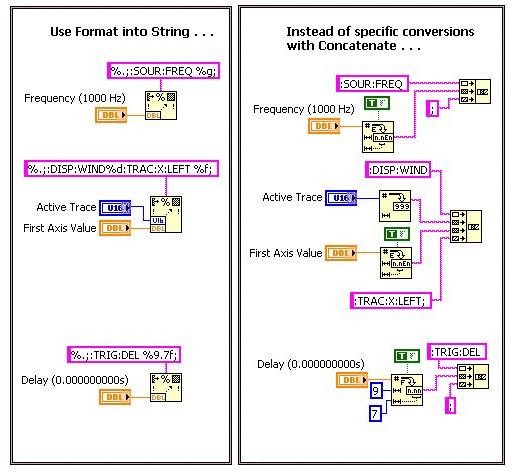
Use Scan From String and Format Into String as often as possible for string manipulation. Other string handling functions, such as Pick Line and Append True/False String, are good string manipulation functions to use.
Use the Format into String function to format multiple values and multiple data types into a string. The VIs in the figure below formats data types into strings using the Format into String function.
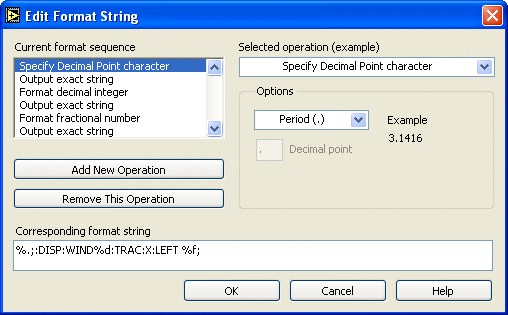
Use the Edit Format String dialog box to create the format string. Double-click the Format into String function to display the Edit Format String dialog box, as shown in the figure below.
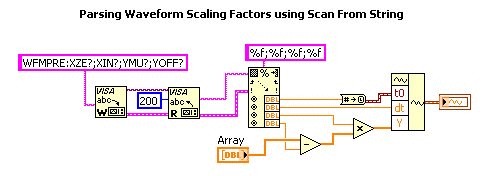
Use the Scan from String function to parse instrument command strings an instrument returns. The VI in the figure below parses multiple values using a single Scan from String function.
Use the Append True/False String or Pick Line to select Boolean or Text Ring values. Use the Append True/False String function to select a string and concatenate it to the command string in a single step, as shown in the figure below.
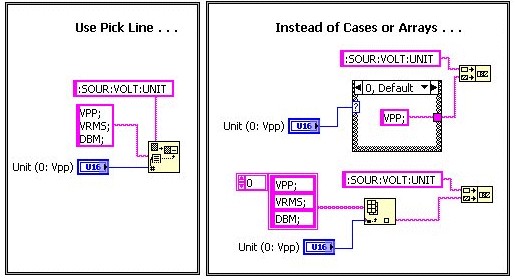
Use the Pick Line function to select a string from a Text Ring. The function lets you select a string based on the label value and concatenates to the command string. The VI in the figure below demonstrates using the Pick Line function.
Design the Block Diagram so it Follows the Left-to-Right, Top-to-Bottom Model of Data Flow
Recommended
The positions of the program elements do not determine execution order. However, avoid wiring from right to left because this breaks the data flow model and makes the block diagram more difficult to understand.
Use Dataflow and Direct Wire Connections to Specify the Execution Sequence
Recommended
- Link functions and VIs together using the VISA resource name and error clusters to ensure execution order.
- Use Sequence structures only when you cannot make a wire connection or want to force data dependency and cannot do so any other way.
Use VISA resource names and error clusters to force data dependencies. Avoid using the Stacked Sequence Structure to enforce data flow because the structure hides parts of your diagram and makes it difficult to understand and modify. Also, the Stacked Sequence and Flat Sequence structures tend to be slower than chaining VIs together because sequence structures force all code within a given frame to wait until that frame executes. Chaining VIs together fixes the sequence of the I/O VIs and you still can execute parsing and formatting functions according to data availability.
LabVIEW instrument drivers use the National Instruments standard for error reporting based on the error cluster. Each error cluster includes an error status Boolean, an error code numeric, and an error source string. Each instrument driver VI includes an error in terminal in the lower left terminal and an error out terminal on the lower right terminal on the VI connector pane. The VI in the figure below includes standard error in and error out terminals.
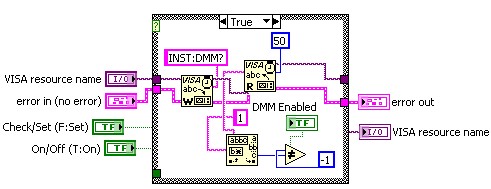
Wiring the error out cluster of one subVI to the error in cluster of another subVI passes error information through your instrument driver and returns any errors to the top-level VI the user sees. The block diagram in the figure below use the VISA resource name and the error cluster inputs and outputs to enforce data flow.
Wire Block Diagram Objects Together as Neatly and Orderly as You Can
Recommended
- Eliminate unnecessary bends in the wires.
- Align and distribute terminals, constants, VIs, and functions.
To make the block diagram easy to understand and modify, reduce the number of bends in the wires by aligning the source and destination of the wires. Use consistent padding when you distribute nodes on the block diagram. The VIs in the figures below use properly aligned wires to improve block diagram readability.
Use Block Diagram Labels to Document Your Code
Recommended
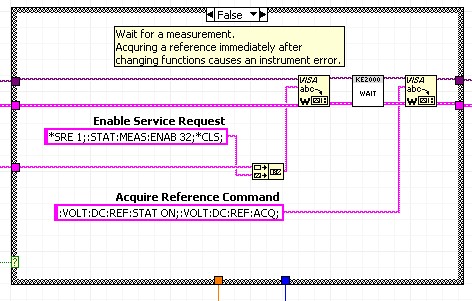
- Document each case in a case structure.
- Document complicated algorithms.
- Document non-standard instrument control code.
- Use descriptive labels on block diagram constants.
Try to make the block diagram as easy as possible to understand and modify. Use the free labels found on the Functions»Decorations palette to document any obscure part of the block diagram. Use multiple lines of text if necessary.
Use labels for constants where their functionality is not obvious.
The block diagram in the figure uses text in Case Structures and labels in constants to improve readability.
Select the Following Options in the User Options Dialog. Ensure All VIs in Your API Have These Settings.
Recommended
- Make terminal and VI labels transparent.
- Disable View as Icon for front panel terminals.
- Select Disable automatic error handling from the VI Properties >> Execution.
- Use default colors for the block diagram background and structures.
Set User Options so each new VI you create or edit uses the recommended settings. However, if you encounter an instrument driver VI saved without the appropriate User Options selected, then you must manually set these options in the VI. Use transparent labels to make the block diagram easier to read. Use data type terminals instead of icon terminals to conserve space on the block diagram. Use default colors to provide consistency with other VI block diagrams. The block diagram in the figure below does not use standard settings and is difficult to understand.
Do not enable Automatic error handling. Individual users should enable or disable this feature, depending on their preference. Instrument drivers handle errors internally, so users who enable Automatic error handling in their applications receive error message dialog boxes if an error occurs within the instrument driver.
Save the VI so the Block Diagram Opens in the Top Left Corner of the Screen When Opened. The Block Diagram Must Fit Within 1024x726 Resolution.
Recommended
The size of the block diagram window affects how readable it is. Make the block diagram window no larger than the screen size. In addition to the size of the block diagram window, ensure that the block diagram requires the user to scroll a minimal amount. If users must scroll, make sure they have to scroll in one direction, horizontal or vertical.
Consider recreating the block diagram if it is too large by using subVIs to modularize the code.
Do Not Use Save Options That Remove or Password-Protect the Block Diagram
Most users do not modify the instrument driver VIs. However, allow them to access the block diagram in case they need to optimize or modify the code. Some customers modify the code to optimize performance. Some customers use the instrument driver as a basis for other instrument drivers that control a similar instrument. Some customers need to debug the driver when instrument firmware changes.

