Investigating Memory Growth Issues in LabVIEW Code Modules Called from TestStand
Overview
Although LabVIEW manages memory automatically, a LabVIEW code module may still contribute to memory growth in a TestStand system, especially if the code module is being called frequently or is manipulating large data sets. Because memory growth can cause errors, crashes, or instability during a test execution, it is important to write LabVIEW code modules in a way that optimizes memory usage.
This document covers the most common causes of memory growth in LabVIEW code modules and provides detail on the various profiling tools provided by LabVIEW for investigating memory growth issues.
Contents
- Process for Locating Memory Growth in a LabVIEW Code Module
- Tools for Measuring LabVIEW Memory Growth
- Causes of Memory Growth in LabVIEW Code
- Resolving Memory Growth Issues and Re-Evaluating Performance
Process for Locating Memory Growth in a LabVIEW Code Module
The process for narrowing down memory growth in a LabVIEW code module is very similar to the process used for narrowing down memory growth in a test system described in the rest of the Troubleshooting Memory Growth in TestStand Systems debugging process. This process consists of three steps:
- Test a set of code while using a memory profiling tool to track memory usage as the code executes. LabVIEW provides several tools for this purpose. These tools are described later in this document.
- Evaluate the results of the test, and if memory growth still exists, simplify the set of code being executed. In LabVIEW, you can use Diagram Disable structures to temporarily remove subVI calls and other sections of code to reduce the complexity of the VI you are investigating.
- When you identify a minimal set of code that reproduces the memory growth, manually inspect the code to determine why memory is growing. The Causes of Memory Growth in LabVIEW Code section below provides guidance on this portion of the troubleshooting process.
Tools for Measuring LabVIEW Memory Growth
LabVIEW provides several tools that you can use to track memory usage in a LabVIEW VI. These tools are also described in the Monitoring Memory Usage section of the VI Memory Usage topic in the LabVIEW Help.
- Profile Performance and Memory – Within LabVIEW, click Tools » Profile » Performance and Memory to open the LabVIEW memory profiler, which will allow you to measure and display the memory usage of an entire LabVIEW VI as well as all subVIs within the VI. This tool is useful for determining where memory growth is occurring in a large code module. You can use this tool to monitor LabVIEW VIs running in the LabVIEW Development System.
- Show Buffer Allocations – Within LabVIEW, click Tools » Profile » Show Buffer Allocations to open a window which will allow you to configure LabVIEW to indicate where memory buffers are being allocated within a LabVIEW VI. The VI Memory Usage topic in the LabVIEW Help explains cases where buffers are allocated and suggests code optimizations to reduce the number of buffers created within the VI. You can use this toolkit to monitor LabVIEW VIs running in the LabVIEW Development System.
- LabVIEW Desktop Execution Trace Toolkit (DETT) – The LabVIEW Desktop Execution Trace Toolkit is a LabVIEW toolkit which allows you to monitor several aspects of a LabVIEW VI, such as memory usage, reference leaks, and subVI calls. You can use this toolkit to monitor LabVIEW VIs running in the LabVIEW Development System. Additionally, in TestStand 2014 SP1 or newer, you can use DETT to monitor LabVIEW VIs executing in the LabVIEW Runtime within the TestStand Sequence Editor. For more information on using DETT with TestStand, please refer to the TestStand Help.
Additionally, the tools described in the Using Memory Profiling Tools to Characterize Memory Growth Issues in TestStand Systems document can be used to track memory usage of LabVIEW code modules during execution. If the code modules are executing within TestStand using the LabVIEW Development System, be sure to monitor the memory usage of the LabVIEW.exe process.
Causes of Memory Growth in LabVIEW Code
There are many potential causes of memory growth in LabVIEW code modules. Although not every issue is described in this section, the following list will give you a starting point to understand which types of code can cause memory growth to occur.
Array and String Operations
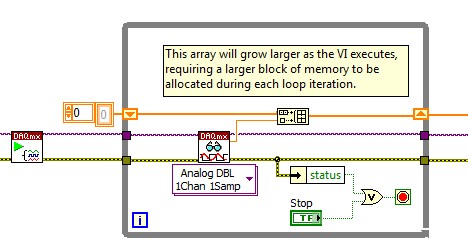
Memory growth is likely to occur in a LabVIEW code module when the LabVIEW code is creating or modifying arrays or strings. As the array or string grows, LabVIEW must allocate larger blocks of contiguous memory to store the data, which will result in an increase of memory usage by the code module. This usage pattern is common in code modules which acquire data from an instrument.
You can detect this type of memory growth using the Profile Performance and Memory tool described above, or by using an external memory logging tool such as Performance Monitor. For example, if the code module is accumulating measurement data in an array over time, you will see the memory usage of the VI or process increase steadily as the code module executes.
Uninitialized Shift Registers
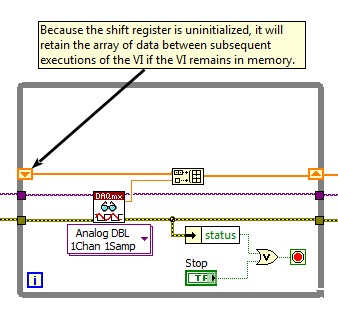
If a LabVIEW code module includes an uninitialized shift register and the VI remains in memory between subsequent executions of the code module, the shift register will retain its previous value. In code which uses a shift register to accumulate values in an array or string, this can result in unexpected memory growth. For this reason, you should carefully consider whether uninitialized shift registers should instead be initialized to a default value.
In some cases, you may be able to detect this cause of memory growth by observing data from Performance Monitor or another memory logging tool and noticing that memory usage remains high after a LabVIEW code module completes execution and continues to grow when the code module is executed a second time. However, regardless of whether you observe memory growth caused by an uninitialized shift register, it is highly recommended that you review the use of shift registers in your LabVIEW code modules to ensure that shift registers are initialized to a default value where possible.
File, Object, and Hardware References
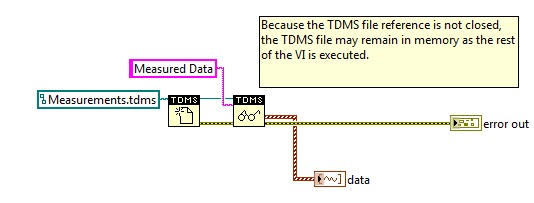
Failing to close a reference to a file, object, or hardware device is a common cause of memory growth issues in all programming languages. LabVIEW manages memory automatically and will close references when a VI is unloaded from memory. However, references which are not explicitly closed will remain in memory until the VI is unloaded, which can impact the amount of memory available to other code modules. For this reason, it is always best practice to explicitly close references when they are no longer needed by the VI.
The LabVIEW Desktop Execution Trace Toolkit (DETT) will often detect instances where a reference was not released when a LabVIEW code modules completes execution. However, you should review any section of code which is opening references to resources and ensure that the references are closed properly when they are no longer needed.
TestStand References
In LabVIEW code which uses the TestStand API, it is important to close references which were created within the VI. If a TestStand reference is not closed properly, the memory being used to hold the referenced data will not be released until the VI is unloaded from memory.
The LabVIEW Desktop Execution Trace Toolkit (DETT) will often detect instances where a reference was not released when a LabVIEW code modules completes execution. However, you should review any section of code which is opening references to resources and ensure that the references are closed properly when they are no longer needed.
Note: The TestStand PropertyObjects Were Not Released warning dialog will not display TestStand reference leaks in LabVIEW code modules because LabVIEW automatically releases leaked references when the LabVIEW adapter unloads the VI, which occurs before a TestStand application exits.
Resolving Memory Growth Issues and Re-Evaluating Performance
Once you have identified the cause of memory growth in your LabVIEW code module, you will need to come up with a strategy to mitigate the memory growth. In some cases, you may be able to modify the code to prevent memory growth, but it is not always possible to avoid memory growth when a code module is executed. If you are unable to resolve the memory growth through a simple code modification, you may be able to mitigate the memory growth by using one of the following methods:
- Initialize arrays before using them, rather than building the array as the code module executes. This will allow LabVIEW to acquire a contiguous memory block for the array rather than repeatedly acquiring larger blocks of memory for the array.
- Restructure the code module so that a smaller set of data is retained in memory as the code module executes. For example, in a code module which is loading a file or acquiring data from hardware, you may be able to change the code module so that a smaller amount of data is loaded into memory.
- Modify the TestStand settings for loading and unloading code modules to dynamically unload code modules from memory once they have finished executing. This will cause all memory and references associated with the LabVIEW VI to be released, freeing this memory for use by other code modules. If you use this approach, you will need to change the Unload Option to Unload After Step Executes for any steps which directly call the code module, as well as any steps where the code module is called as a subVI of another code module.
Once you have made changes to the code module or used one of the mitigation strategies described above, you should repeat the troubleshooting process described above to re-evaluate the performance of the code module and determine whether the changes and mitigations you have implemented were effective in reducing memory growth.


