Benchmarks for the NI 9144 Expansion Chassis
Contents
The NI EtherCAT reconfigurable I/O (RIO) expansion chassis is designed to provide synchronized, distributed I/O over a deterministic network. Programmed with the NI LabVIEW Real-Time Module, the chassis can be daisy chained from NI real-time programmable automation controllers (PACs) with two Ethernet ports in the following platforms: NI CompactRIO, PXI, and NI industrial controllers. Plus, each EtherCAT RIO chassis has a field-programmable gate array (FPGA) that you can program with the LabVIEW FPGA Module for intelligent, distributed devices capable of custom timing and inline processing. This white paper examines the technical details and performance results for the NI 9144 system loop-rate benchmarks using the NI Scan Engine in LabVIEW Real-Time.
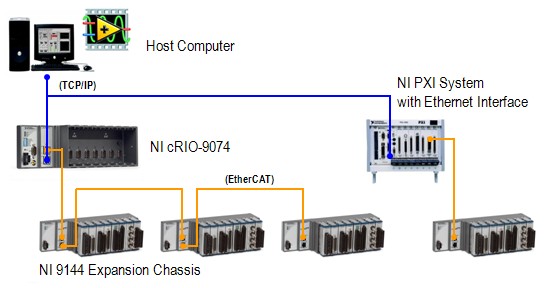
Figure 1. Real-Time Ethernet Expansion System Using the NI 9144 Chassis
Real-Time Ethernet Benchmarks
The communication network between the master controller and the NI 9144 is based on an open, real-time Ethernet protocol called EtherCAT. At a high level, EtherCAT benchmarks consist of four components: logic, driver, EtherCAT network, and I/O.
Figure 2. Components of the Master and Slave Benchmarks
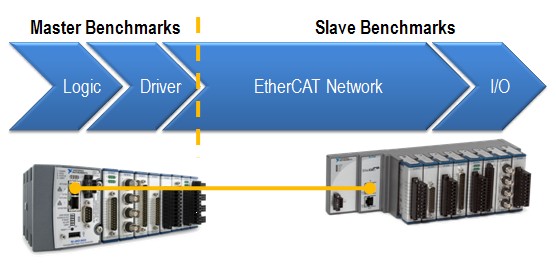
For the EtherCAT master device, the master benchmarks depend on the user’s code and the EtherCAT driver, which moves data between the code and the EtherCAT network. In general, the EtherCAT master controller is usually the limiting factor in system loop rates because its processing power greatly affects how fast data is processed in the user logic and driver. The more powerful the controller, the more I/O data it can handle in a shorter period of time.
The slave device benchmarks, on the other hand, depend on how long the packet travels on the EtherCAT network as well as how fast the slave I/O can update. The packet speed of the EtherCAT network is affected by many factors, such as the number of slave device nodes, the length of the Ethernet cable, and, most importantly, how much I/O data is being pushed across the wire. As a deterministic protocol, the EtherCAT network timing is precisely calculated so that the master knows exactly when the slaves are updating and transferring data. Not surprisingly, the speed of the EtherCAT network is the fastest component of the entire system loop rate.
When using the NI 9144 EtherCAT RIO chassis with NI PACs, these benchmark components map to the following components:
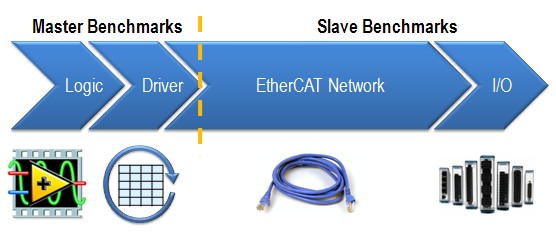
Figure 3. Components of the NI Master and Slave Benchmarks
The logic is the user-created LabVIEW code, and the driver refers to the NI Scan Engine in LabVIEW and NI-Industrial Communications for EtherCAT software. The EtherCAT network is the communication over the physical Ethernet cable, and the I/O refers to C Series I/O modules. All of these software and hardware pieces make up the entire system loop rate of your NI system.
NI System Loop Benchmarks
During a single scan loop or cycle, the transfer of the EtherCAT packet, or I/O scan, must be synchronized between the master controller and NI 9144 slave chassis. During the I/O scan, the master sends out a packet with new outputs and instructions for the slaves, and the slaves return the packet with new input values for the master. Using the updated data from the EtherCAT packet, the master begins the program scan and the NI 9144 chassis begin the slave update. The program scan is the time the master takes to process data and run the LabVIEW program. The slave update is the time the slave uses for DMA transfers, data processing, and I/O updating. Therefore, the minimum loop rate is limited by either the program scan or the slave update, depending on which one takes more time.
Figure 4. Scan Cycle Timing Diagram
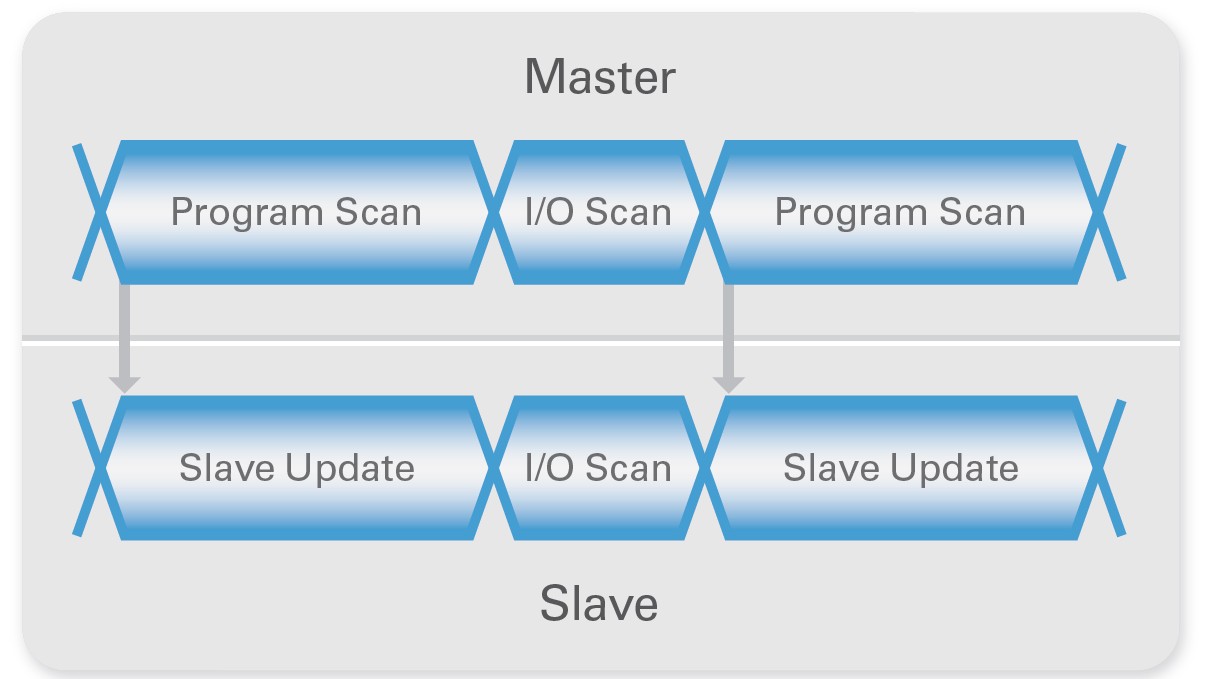
The program scan time increases with the number of slaves and I/O on the network because the master controller has more data to process. However, the slave update time does not increase because the slaves update their I/O at the same time in parallel. Therefore, the more slave I/O on the network, the more likely the master’s program scan becomes the bottleneck. If your application involves a high I/O channel count, consider using a high-performance controller such as PXI for the master.
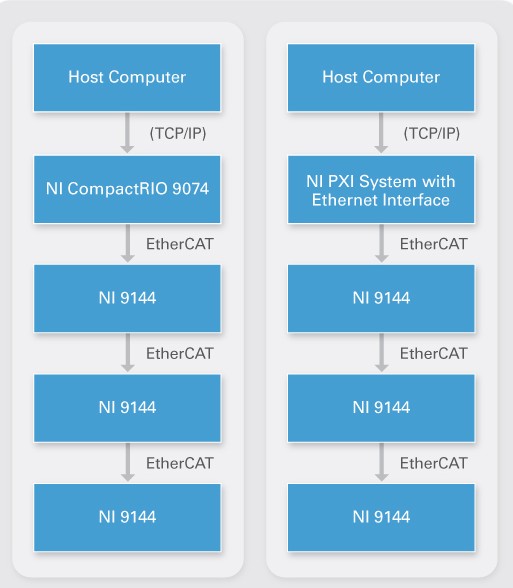
Figure 5. CompactRIO and PXI Systems With NI 9144 Chassis
Master Controller Benchmarks
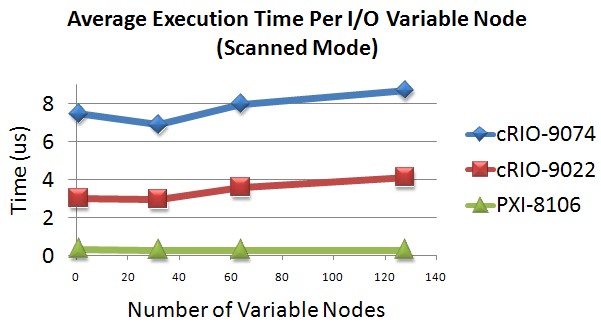
The default LabVIEW programming mode for the master controller is to run the NI Scan Engine, which is a component of LabVIEW Real-Time that scans single-point I/O values into memory at a user-specified rate. For the purposes of the master controller benchmarks, the amount of time it takes to run the user’s code is not calculated. Therefore, the remaining master benchmark component is the driver speed, which includes the amount of time the controller takes to transfer data between the NI Scan Engine memory map into the I/O variable. I/O variables are used to access data from the NI Scan Engine memory map, and each instance of an I/O variable node in a LabVIEW VI takes time to execute. The average execution time of each I/O variable node tends to remain constant even as the number of nodes on the block diagram increases, and the chart in Figure 6 displays this execution time for certain master controllers. Based on this data, the average execution time per I/O variable node is approximately 8 µs for the NI cRIO-9074 integrated system, 3.5 µs for the NI cRIO-9022 embedded real-time controller, and 0.3 µs for the NI PXI-8106 dual-core embedded controller.
Figure 6. Average Execution Time per I/O Variable Node
Note: This is not a complete list of all compatible NI controllers. See the Deterministic Ethernet Product Selection Guide for more information. In general, the more powerful the processor, the faster the I/O variables are executed.
Slave Device Benchmarks
Customers often ask for the maximum number of NI 9144 chassis that they can daisy chain from the master controller. Theoretically, the EtherCAT protocol states that the maximum number of slaves in one network is 65,535 devices, but having that many devices controlled by one master controller significantly slows down the scan rate and most likely is best implemented with multiple masters instead. In reality, the number of I/O channels, not the number of slave devices, has more impact on the system scan rate from the master side. As seen in Figure 4, the master’s program scan increases as more data is pushed over the EtherCAT network, typically overshadowing the slave update time. Therefore, despite the amount of overhead added for each slave device, 300 I/O channels divided among two or 20 NI 9144 chassis have approximately the same system loop rate.
Combined System Loop Rate
Table 1 combines the benchmarks for the master controller and the NI 9144 to form the minimum cycle time, or system loop rate.
Minimum Cycle Time = Driver + EtherCAT Network + I/O Updates
Note that these benchmarks do not include the amount of time the user’s code takes to run, so add the appropriate time for the code and see the related links below for more information.
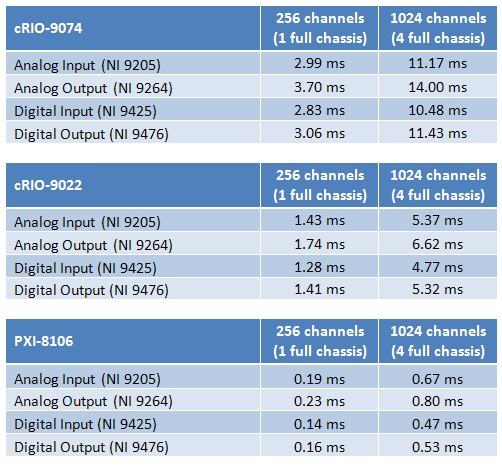
Table 1. System Loop Rates
Based on the tests for these two controllers and four different I/O modules, a benchmarking spreadsheet called system_loop_rate_chart2.xls is attached at the end of this white paper to help you approximate the system loop rate for your configuration. Simply enter the number of analog and digital I/O channels you are using as well as the approximate time for running the LabVIEW code to calculate the system loop rate. Remember that these formulas are based on a specific hardware setup, and results may vary when using other I/O modules.
NI 9144 Only Benchmarks
You may also use the NI 9144 expansion chassis with other third-party EtherCAT masters but without the easy-to-use programming experience that LabVIEW offers. In such cases, benchmarks are provided for just the NI 9144 and EtherCAT network without any master benchmark components. Remember that this is the minimum achievable cycle time; to calculate the actual system loop rate, you need to determine and compare the master’s program scan and execution times. The formula is made of two parts:
Minimum Slave Cycle Time = Packet Transmission Time + Slave Update Time
Packet Transmission Time
Once the EtherCAT packet leaves the master, the packet transmission time refers to the summation of the frame transmission, communication delay, and any jitter introduced along the way.
Packet Transmission Time = Frame Transmission Time + Communication Delay + Jitter
The frame transmission introduces 80 ns for every byte of EtherCAT data as well as 5 µs for every EtherCAT frame that carries the data. (This total EtherCAT data directly corresponds to the number and type of I/O channels in the NI 9144 chassis.) The communication delay accounts for 600 ns for every NI 9144 chassis and 5 ns for every meter of Ethernet cable.
Slave Update Time
After the EtherCAT packet streams through all of the slaves and back to the master without stopping, all the slaves read inputs and write outputs in parallel. Therefore, the slave device with the worst case slave update time determines the minimum slave cycle time for your system.
Slave Update Time = DMA Transfer Time + Worst Case Module Timing
To determine this, you must consider the unique module configurations for all NI 9144 chassis. Based on the modules in the chassis, you can calculate the DMA transfer time for input and output data. You also can determine the module with the worst case initiation, conversion, and refraction timing. Find the worst case slave update time by adding these values together.
Note: Since the release of LabVIEW 2009, you can program the modules in the NI 9144 at the hardware level using the LabVIEW FPGA Module. Therefore, you can take advantage of modules that have faster update rates than the system loop rate. By collecting the I/O at the module’s maximum speed, use the FPGA code to do custom signal manipulation and inline processing, and then return the final result to the master controller.
Combined Slave Cycle Time
Because you can use many different combinations of modules in the NI 9144, another benchmarks spreadsheet called ni_9144_only_benchmarks.xls is provided below to apply all of these formulas and accurately calculate the minimum slave cycle time. Once you have entered the correct values, add the benchmarks from the third-party master to the calculated slave benchmarks to determine the entire system update rate for the application. For an extra boost in high-speed performance, use the LabVIEW FPGA capabilities to download custom intelligence onto the NI 9144.
