Debugging Multicore ANSI C Applications with LabWindows™/CVI
Overview
The advent of multicore processors presents significant benefits over traditional single-core architectures including increased throughput and performance, cheaper processing power, and lower power consumption – which are all critical for today’s test systems and embedded devices. Along with these benefits, the additional hardware complexity raises significant new software development challenges. Executing tasks in parallel often uncovers design flaws that go unnoticed in single-threaded applications – especially when correct application behavior depends on the precise timing of execution, memory access, and communication between multiple tasks. LabWindows/CVI not only provides simplified ANSI C thread synchronization functions and optimized threading constructs to address these challenges but also contains several advanced features that simplify troubleshooting and design optimization on multicore systems. This white paper offers an overview of LabWindows/CVI tools for debugging multicore applications.
Contents
- Introduction to Multithreading in LabWindows/CVI
- Debug Run-Time Behavior
- Introduction to the NI Real-Time Execution Trace Toolkit 2.0
- Verify Expected Timing Behavior and Thread Priorities
- Identify Shared Resources and Memory Allocation
- View Processor Affinity and Monitor Multicore Interaction
- More Resources on ANSI C Multicore Programming and Debugging
Introduction to Multithreading in LabWindows/CVI
NI LabWindows/CVI software has natively supported multithreaded application creation since the mid-1990s. Now, with the widespread availability of multicore CPUs, you can use LabWindows/CVI to fully take advantage of multithreaded technology capabilities.
The LabWindows/CVI Multithreading Library provides the following multiple performance optimizations over standard Windows SDK threading APIs:
-
Thread pools help you schedule functions for execution in separate threads. Thread pools handle thread caching to minimize the overhead associated with creating and destroying threads.
-
Thread-safe queues abstract passing data between threads. One thread can read from a queue at the same time that another thread writes to the queue.
-
Thread-safe variables effectively combine a critical section and an arbitrary data type. You can call a single function to acquire the critical section, set the variable value, and release the critical section.
-
Thread locks simplify using a critical section or mutex by providing a consistent API and by automatically choosing the appropriate mechanism when necessary. For example, LabWindows/CVI automatically uses a mutex if the lock needs to be shared between processes or if threads need to process messages while waiting for the lock. A critical section is used in other cases because it is more efficient.
-
Thread-local variables provide per-thread instances of variables. The operating system places a limitation on the number of thread-local variables available to each process. The LabWindows/CVI implementation consolidates the thread-local variables, using only one process thread-local variable for all of the thread-local variables in your program.
You can find all of the multithreading functions in the LabWindows/CVI Library Tree under Utility Library»Multithreading.
Read More:
Multithreading in LabWindows/CVI In-Depth White Paper
Debug Run-Time Behavior
As with single-threaded applications, having insight into the behavior of your application while it is running is crucial. When creating multithreaded applications, it is important to track the execution of not only one thread but all threads as they run in parallel. Function-level debugging tools such as watch statements, breakpoints, and stack traces are available when debugging multithreading applications.
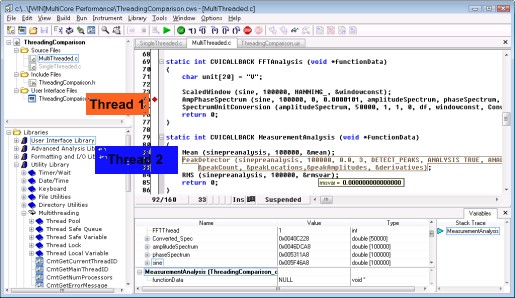
In particular, you can use the LabWindows/CVI Threads window to view detailed debugging information on a per-thread basis. The Threads window lists all threads in the program that are being debugged.
Figure 1. With the LabWindows/CVI Threads window, you can easily switch between threads currently being debugged in the environment.
You can use this dialog box to select the threads whose local variables and call stack you want to view. When you select a thread from this dialog box and click View, LabWindows/CVI displays the local variables for the selected thread in the Variables window and displays the current source position of the thread in the Source window. The Up Call Stack, Down Call Stack, and Call Trace commands in the Run menu display information about the selected thread.
Figure 2. LabWindows/CVI displays the local variables for the selected thread in the Variables window and displays the current position of the thread in the Source window.
Introduction to the NI Real-Time Execution Trace Toolkit 2.0
Accessing low-level execution information is critical for optimizing and debugging real-time applications because you can easily identify sources of jitter such as processor affinity, memory allocations, priority inheritance, or race conditions. If you are developing a real-time application, the best way to monitor detailed CPU usage, execution timing, and other events is by capturing execution traces from real-time targets. With the Real-Time Execution Trace Toolkit 2.0, which supports both the LabWindows/CVI Real-Time Module and the LabVIEW Real-Time Module, you can view and analyze the execution traces of real-time tasks including functions and operating system threads on single-core and multicore systems. With the trace results, you can find hotspots in your code and detect undesirable behaviors such as resource contention, thread starvation, memory allocations, and priority inversions, while verifying expected timing behavior and monitoring CPU utilization. LabWindows/CVI Real-Time versions 8.5 and later include a free 7-day evaluation of the Real-Time Execution Trace Toolkit. Select Tools>>Real-Time Execution Trace Tool to display the Real-Time Execution Trace Toolkit.
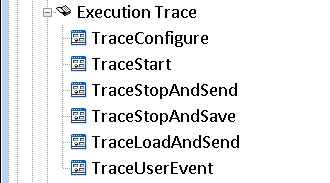
The Real-Time Execution Trace Toolkit consists of two parts: The Execution Trace functions, found in the LabWindows/CVI Real-Time Utility Library, and the Trace Viewing Utility. You can add the Execution Trace functions around the code whose execution you would like to trace and use the Trace Viewing Utility to capture execution traces.
Figure 3. Find the Execution Trace functions in the LabWindows/CVI Real-Time Utility Library.
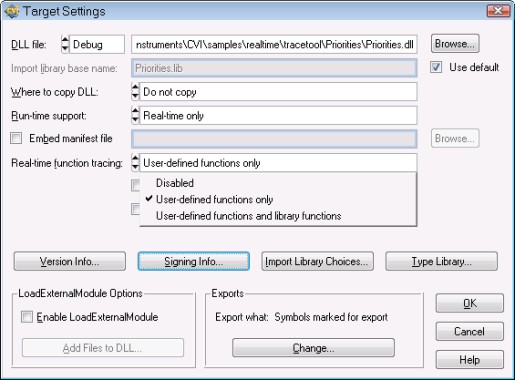
Figure 4. You can trace not only user-defined functions but also LabWindows/CVI library functions that you call in your application. Enable these settings in the Build Options menu.
Verify Expected Timing Behavior and Thread Priorities
With the Real-Time Execution Trace Toolkit, you can visualize application behavior on the thread and function levels. The Real-Time Execution Trace Toolkit displays all function event data and threads executed on the real-time target with respect to time. The Real-Time Execution Trace Toolkit displays the time range in the current view, which aids in understanding how threads interact. In addition, function and thread activity is identified in different colors to distinguish the execution priority of each event. With the ability to zoom in and out of specific areas in the execution trace, you can pinpoint the exact location of performance issues in your application.
Figure 5. The Function view displays detailed execution time and priority information for each user-defined function.
Identify Shared Resources and Memory Allocation
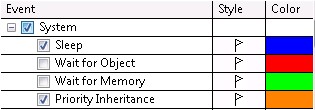
Using shared resources in a time-critical thread (a thread that needs to execute within a deterministic amount of time) can introduce extra jitter in your real-time application. Specific system events, such as sleep spans, memory manager calls, and resource mutexes, can introduce jitter, but the Real-Time Execution Trace Toolkit detects these events and displays a flag followed by a dashed line in the Threads view to indicate the time range for the occurrence of the system event.
The Real-Time Execution Trace Toolkit can detect the following system events:
- Sleep – Occurs when a thread sleeps to allow lower-priority threads to execute.
- Wait For Object – Occurs when a thread waits for a low-level resource, such as an event or mutex, before executing.
- Wait For Memory – Occurs when a thread conducts any memory management operation. The span is the amount of time it takes to complete the memory management operation. By default, the Real-Time Execution Trace Toolkit displays Wait For Memory span events using a green flag.
- Priority Inheritance – Occurs when a thread inherits the priority of a higher-priority thread because the lower-priority thread is holding a shared resource required by the higher-priority thread.
Figure 6. System events are marked with colored flags.
For example, when a normal-priority loop is in possession of a shared resource, such as a thread lock, other threads, including time-critical threads that try to acquire the lock, must wait for the shared resource to become available. In this case, jitter is inevitably introduced in the time-critical thread. To prevent such situations, NI recommends avoiding the use of shared resources in time-critical loops.
The following code creates a high-priority thread and a normal-priority thread. The normal priority thread acquires a lock before the high-priority thread. When the high-priority thread tries to acquire the lock, it is forced to wait until the normal-priority thread releases the lock.
RTMain
| __declspec (dllexport) void CVIFUNC_C RTmain (void) { … CmtNewLock (NULL, OPT_TL_PROCESS_EVENTS_WHILE_WAITING, &lock); /* schedule the thread functions */ CmtScheduleThreadPoolFunctionAdv (pool, NormalPriorityLoop, NULL, THREAD_PRIORITY_NORMAL, NULL, 0, NULL, 0, &functions[0]); CmtScheduleThreadPoolFunctionAdv (pool, TimeCriticalLoop, NULL, THREAD_PRIORITY_TIME_CRITICAL, NULL, 0, NULL, 0, &functions[1]); … } |
NormalPriorityLoop
| static int CVICALLBACK NormalPriorityLoop (void *functionData) { CmtGetLock(lock); Sleep(3); CmtReleaseLock(lock); return 0; } |
TimeCriticalLoop
| static int CVICALLBACK NormalPriorityLoop (void *functionData) { Sleep(1); CmtGetLock(lock); Sleep(3); CmtReleaseLock(lock); return 0; } |
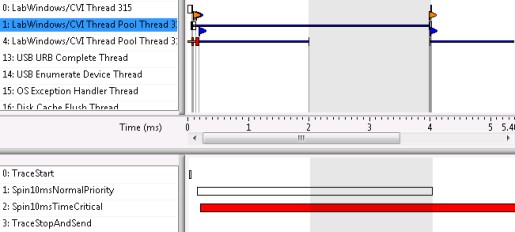
The Real-Time Execution Trace Toolkit shows the time-critical thread (4: LabWindows/CVI Thread Pool Thread 3 ) waiting for the lower-priority thread (1: LabWindows/CVI Thread Pool Thread 3) to release a lock, thus potentially resulting in decreased determinism.
Figure 7. As indicated by the highlighted area, the Real-Time Execution Trace Toolkit shows the time-critical thread waiting for the normal-priority thread to release a shared resource.
View Processor Affinity and Monitor Multicore Interaction
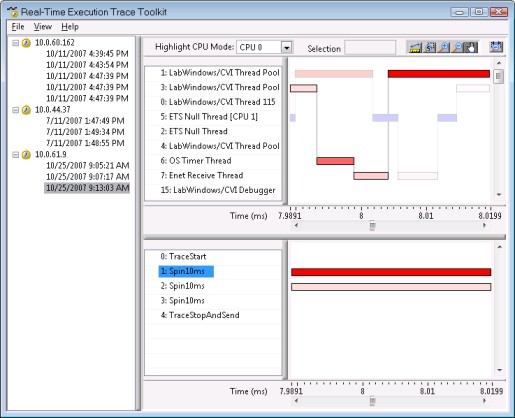
According to a survey conducted by Virtutech of Embedded Systems Conference 2007 attendees (San Jose, California), 59 percent of respondents said that their debugging tools do not support multicore or multiprocessor development. On the other hand, the Real-Time Execution Trace Toolkit includes a Highlight CPU Mode option that you can use to highlight all thread activity that executes on a particular CPU. By highlighting all the thread activity on a particular CPU, you can trace the execution path of each CPU in the system to determine whether the threads executed as you intended. Also, by seeing processor use in the trace tool, you can prototype the performance potential of different designs based on your assignment of various portions of your code to particular processors.
Figure 8. Select a particular CPU from the Highlight CPU Mode options to highlight all thread activity that executed on that CPU.
More Resources on ANSI C Multicore Programming and Debugging
LabWindows/CVI contains several features that simplify debugging multicore applications. You can use the Threads view, Watch window, and Variable window to visually monitor functions as they execute on different cores. In addition, the Real-Time Execution Trace Toolkit can ease the transition to multicore processors in real-time applications by simplifying troubleshooting and design optimizations. Explore the following resources to learn more about creating multithreaded ANSI C applications that take advantage of multicore architectures in LabWindows/CVI.
- Multicore Programming Fundamentals Series
- Read More about ANSI C Multithreading in LabWindows/CVI
- Learn More about LabWindows/CVI
The mark LabWindows is used under a license from Microsoft Corporation.

