Multicore Programming with LabVIEW
Overview
Contents
- The Parallel Programming Challenge
- Automatically Taking Advantage of Multicore Processors
- Manual Thread Creation
- Intuitively Visualizing Parallel Code
- Task Parallelism
- Data Parallelism
- Pipelining
- Powerful Graphical Debugging Tools
- "Multicore-Ready" Software Stack with Real-Time SMP Support
- Solving the Most Challenging Engineering Problems
The Parallel Programming Challenge
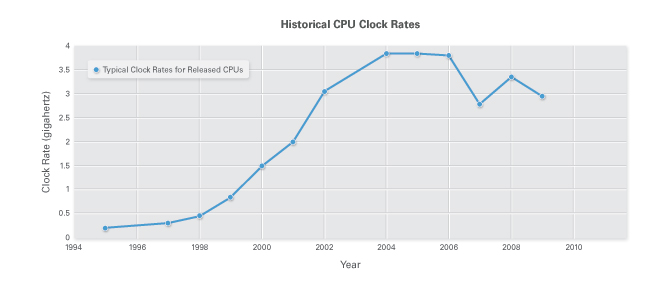
Parallel programming is fast becoming a necessity in order to make the most of multicore processors. For many reasons, including power consumption and memory bandwidth, modern processors have largely stagnant clock rates; CPU manufacturers have instead begun to include multiple processor cores on a single chip while maintaining or even decreasing the clock frequency. So instead of relying on clock rate increases to automatically speed up applications, you must now design applications to run on multicore processors. In the future, if you do not take the time to optimize applications for multicore processors, you may see decreases in performance.
To address this challenge, many tools have evolved to help you create code that can take advantage of multicore processors. You can manually assign pieces of code to threads, which many OSs can then spread across different processor cores. However, managing these threads can be time-consuming and difficult. Furthermore, various languages and APIs abstract some of the work associated with threads, but they still require that you specify exactly what operations can run in parallel.

Figure 1: CPU clock rates have stopped increasing and multicore processors are the performance growth area now.
Automatically Taking Advantage of Multicore Processors
Programming in LabVIEW involves creating graphical code (G) that resembles a flowchart, which is significantly different than programming in traditional sequential languages. This is known as dataflow programming. Instead of writing a sequence of commands that execute one-by-one, LabVIEW programs contain variables and operations that connect one variable to the next – the LabVIEW compiler automatically determines the order of commands to execute to produce correct results. This also means that, with LabVIEW, when two parallel sections of code are independent of each other, they can run at the same time on different cores of a multicore processor.
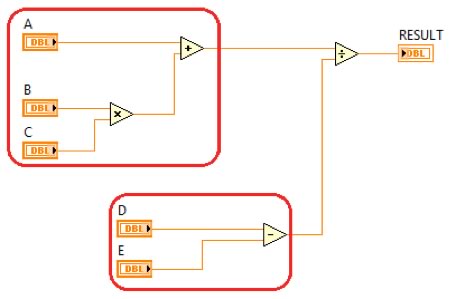
To visualize this, consider the simple arithmetic program shown in Figure 2. LabVIEW can recognize that both the multiply and add functions and the subtract function can execute at the same time; they do not depend on each other to execute.

Figure 2: Independent code paths can execute simultaneously.
The LabVIEW compiler identifies many different pieces of parallel code on the block diagram and maps those pieces onto a fixed number of threads during run time. This prevents you from having to manually handle thread details while avoiding creating too many threads, which can hurt performance.
Manual Thread Creation
The ability of LabVIEW to automatically handle threads and take advantage of multicore processors does not mean that you lose control over doing this if needed. For example, you may want to isolate a specific task such as emergency condition monitoring in a dedicated, high-priority thread. LabVIEW timed structures, including the Timed Loop, each create a single thread that the code inside of the structure runs in, and can be targeted to a specific processor core by setting a processor affinity option either during development or at runtime. With LabVIEW, you focus on the problem you are trying to solve rather than spending time mapping code to multicore processors, without giving up access to low-level control when you need it.
Intuitively Visualizing Parallel Code
LabVIEW has another important advantage for making use of multicore CPUs: intuitive graphical representation of parallel code. While you can use traditional sequential languages to create parallel programs, keeping track of parallel operations can be an imposing challenge. Furthermore, because developers often work together to create large applications, decoding parallel code that you did not write can be even more difficult than decoding your own.
In contrast, the LabVIEW dataflow programming approach draws on one of the most basic forms of communication – the flowchart. For years, sequential programmers have been creating flowcharts to keep track of program elements and communicate with each other. Rather than translating flowcharts to sequential code and vice versa, you can implement ideas directly in graphical dataflow code. You also can quickly identify parallel code paths that can run on different processor cores.
LabVIEW 8.5 introduced the automatic multithreading scheduler from the desktop – known as symmetric multiprocessing (SMP) – to deterministic, real-time systems with enhancements to the LabVIEW Real-Time Module.
Task Parallelism
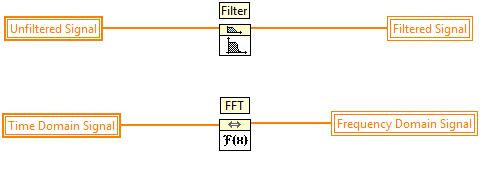
Task parallelism represents two or more separate operations that can execute in parallel. In the LabVIEW code on the right, note that the Filter and fast Fourier transform (FFT) operations do not depend on each other, so they can execute simultaneously on multiple processor cores.

Figure 3: An Example of Task Parallelism
Data Parallelism
Data parallelism is a common programming pattern when you can split a large piece of data and process each piece simultaneously before combining the results. Note the splitting of data channels, processing, and recombining in the code above.

Figure 4: An Example of Data Parallelism
Pipelining
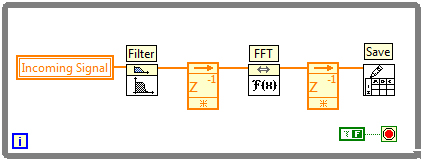
Pipelining represents an operation assembly line in which functions repeatedly execute and pass their data to the next operation for the next iteration. In LabVIEW, pipelining can be represented using unit delays called feedback nodes between the operations.

Figure 5: An Example of Pipelining
Most real-world applications such as RF signal processing and image analysis feature a combination of these and other parallel programming patterns. For example, you could implement multiple pipelines in one LabVIEW block diagram, representing both task parallelism and pipelining. With LabVIEW, you can optimize applications for multicore processors through intuitive visualization of parallel code.
Powerful Graphical Debugging Tools
Debugging is an important part of developing any application, and LabVIEW contains both built-in graphical debugging features and connectivity to add-on tools to help gain insight into parallel program operation. For example, with the highlight execution feature in LabVIEW, you can watch as data flows between operations and parallel code paths execute simultaneously, and the LabVIEW Desktop Execution Trace Toolkit shows the exact sequence of application events. Furthermore, on LabVIEW hardware targets running real-time OSs, the NI Real-Time Execution Trace Toolkit shows a complete program history of which threads run on which CPU cores with detailed timing – helping you identify and correct issues such as priority inversion, where a higher-priority task is kept waiting by a lower-priority task using a shared resource. Being able to see which threads are running when, on which core, and are accessing which resources, means you can fine-tune performance and reliability without the guesswork.
"Multicore-Ready" Software Stack with Real-Time SMP Support
Intel has defined four layers of the software stack that you can use to evaluate multicore development “readiness.” Keep in mind that parallel programs do not run faster on multicore systems if the libraries and drivers you are using are not “multicore ready” or if the operating system cannot load-balance tasks across multiple cores.
| Software Stack | Meaning of “Multicore Ready” | LabVIEW Support |
|---|---|---|
| Development Tool | Support provided on the operating system of choice; tool facilitates correct threading and optimization | Example: Multithreaded nature of LabVIEW and structures that allow for optimization |
| Libraries | Thread-safe, reentrant libraries | Example: Analysis libraries |
| Device drivers | Drivers architected for optimal multithreaded performance | Example: NI-DAQmx driver software |
| Operating system | Operating system supports multithreading and multitasking and can load balance tasks | Example: Support for Windows, Mac OS, Linux, and real-time operating systems |
Figure 6: Description of a “Multicore Ready” Software Stack
An example at the device driver software layer is NI-DAQmx driver software. Traditional NI-DAQ (Legacy) is thread-safe, meaning the entire library blocks other threads from calling into it when an NI-DAQ function is called.
At first glance, this behavior may appear logical because NI-DAQ is used to control hardware, which is often thought of as a single resource. NI-DAQmx, the reengineered modern data acquisition driver, is reentrant – meaning multiple data acquisition tasks can execute in parallel without blocking threads.
With this approach, the driver can run multiple tasks independently, such as analog and digital I/O, in parallel on the same device.
At the lowest level of the software stack, the operating system, many of the leading real-time operating system (RTOS) vendors do not yet support automatic load-balancing of threads across multiple cores.
LabVIEW 8.5 brings the automatic multithreading scheduler from the desktop – known as symmetric multiprocessing (SMP) – to deterministic, real-time systems with enhancements to the LabVIEW Real-Time Module.
Solving the Most Challenging Engineering Problems
In addition to programming multicore CPUs, you can use LabVIEW with other parallel hardware, including FPGAs, graphical processing units, and even computing clouds. These hardware platforms each have unique characteristics, advantages, and tradeoffs, and LabVIEW empowers engineers and scientists to take advantage of the right platform for the job. Because LabVIEW targets these different pieces of hardware, you can use graphical programming to tackle a wide variety of projects with different parallel processing requirements.
In fact, researchers working on some of the most complex engineering problems on the planet – from researching fusion to controlling the world’s largest telescope – are using LabVIEW along with a variety of parallel hardware targets for their applications. Ultimately, LabVIEW exists to help experts in a wide range of fields quickly turn ideas into functioning programs. Because LabVIEW is able to automatically take advantage of multicore processors using intuitive graphical code, you can continually use the latest parallel hardware to solve the next generation of engineering challenges.