Joint Time-Frequency Analysis (JTFA) Overview
Overview
Contents
- Introduction
- Where does JTFA fit?
- Seeing the frequency content of a signal evolve over time
- JTFA with NI Software
Introduction
One common method of visualizing a signal is in the time domain. This representation often plots the signal value (commonly a voltage or current that represents some other measurement, such as temperature or strain) as a function of time. Another useful signal representation is the frequency-domain view of the signal. This representation is typically based on a variation of the Fourier Transform and commonly plots the magnitude or phase content of a signal as a function of frequency. By examining the frequency-domain view of a signal, you derive information about your signal that might not be immediately apparent from an examination of the time-domain representation.
Although frequency-domain representations such as the power spectrum of a signal often show useful information, the representations don’t show how the frequency content of a signal evolves over time. For this task, you can apply a type of Joint Time-Frequency Analysis (JTFA).
Where does JTFA fit?
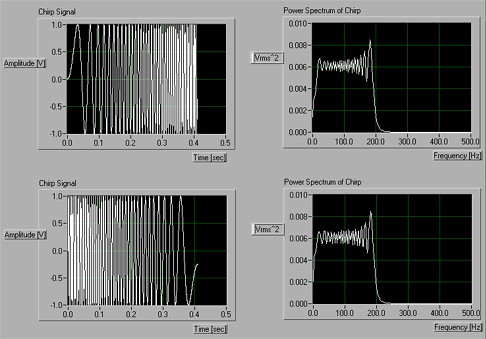
To understand how JTFA and standard frequency-domain analysis differ, consider a chirp signal. As shown in Figure 1, chirp signals contain a single frequency component that shifts from low-to-high or high-to-low frequency as a function of time.

Figure 1: The “direction” of a chirp signal (whether it goes from low-to-high (left) or high-to-low (right) frequency is easy to distinguish when you examine the time-domain representation of a signal.
To study the information regarding the frequencies contained in a signal, you might apply a Fourier Transform and examine the signal’s power spectrum. However, with this technique, it is difficult to tell whether or not a signal's frequency contents evolve in time. Returning to our example, as you can see in Figure 2, the low-to-high frequency version of a chirp signal shows a power spectrum that is identical to its high-to-low frequency counterpart.

Figure 2: Although the time-domain representation (top and bottom, on the left) of two chirp signals is clearly different, the frequency domain representation, a power spectrum, (right) of each is identical.
Seeing the frequency content of a signal evolve over time
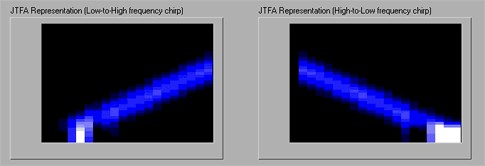
By applying a form of JTFA, you can identify not only the frequency content of a signal, but also how that content evolves over time. Figure 3 shows clearly different representations for the low-to-high and high-to-low frequency chirp signals.

Figure 3: The JTFA of low-to-high (left) and high-to-low (right) frequency chirp signals are clearly different and showing both frequency content (y-axis) and time evolution (x-axis).
JTFA is a set of transforms that maps a one-dimensional time domain signal into a two-dimensional representation of energy versus time and frequency. In the examples above, JTFA shows the frequency content of a signal and the change in frequency with time. There are numerous applications in both research and industry for JTFA. Examples include speech analysis, telecommunications, underwater acoustics, bioacoustics, geophysics, and structural analysis.
There are a number of different transforms available for JTFA. Each transform type shows a different time-frequency representation. The Short Time Fourier Transform (STFT) is the simplest JTFA transform (and the easiest to compute). For the STFT, you apply the well-known Fast Fourier Transform (FFT) repeatedly to short segments of a signal at ever-later positions in time. You can display the result on a 3-D graph or a so-called 2-D 1/2 representation (the energy is mapped to light intensity or color values).
The STFT technique suffers from an inherent coupling between time resolution and frequency resolution (increasing the first decreases the second, and vice versa). This coupling can skew the measurements that you can derive from the transform, such as average instantaneous frequency.
Other JTFA methods and transforms can yield a more precise estimate of the energy in a given Frequency-Time domain. Some options include:
- Gabor spectrogram
- Wavelet transform
- Wigner distribution
- Cohen class transforms
JTFA with NI Software
For online (live data) and offline data analysis with JTFA and related analysis, you can rely on the Advanced Signal Processing Toolkit, which is included with LabVIEW Professional. The software includes ready-to-run executables and a library of functions that follow you through all phases of development, from experimentation to implementation.