Characterize Batteries and Power Consumption Using the NI PXIe-4081 7 ½-digit Digital Multimeter
Contents
- Overview
- Leakage Current and Power Consumption of a Portable Device
- Battery Characterization
- Simplifying Test System Development
Overview
New portable consumer electronic devices that continuously hit the market are faster, smaller, lower cost, and more complex. One doesn't have to look much further than the smartphones likely in his or her pocket to recognize the technological strides in speed, size, and complexity. Maximizing the battery life of these new devices is one of the biggest challenges design engineers face, so it’s not surprising that they now spend a significant portion of their design effort testing and characterizing power consumption and battery performance.
In addition, engineers are challenged to adapt existing test equipment to meet these emerging test requirements. NI's platform is capable of responding to these ever-changing needs by providing a software-centric approach to modular instrumentation. Through software, users have the flexibility to tailor battery test and power consumption test approaches to the exact need. As a result, the test data relates directly to the test requirement. This eliminates the need for the engineer to approximate or guess at what the performance will be from “standard” tests which are often based on outmoded requirements.
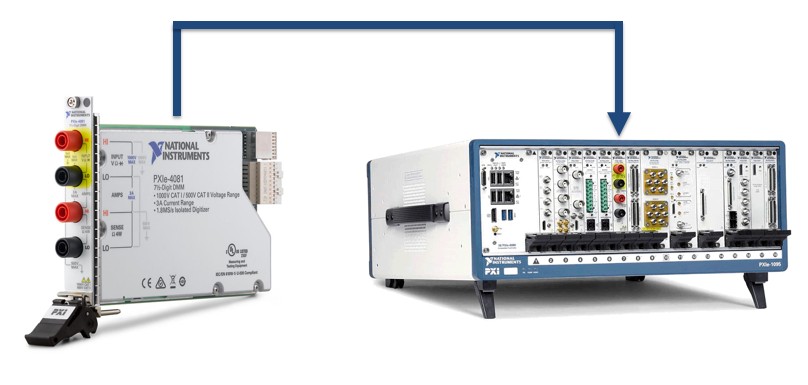
For example, an NI PXI-4081 DMM in conjunction with one of its driver APIs provides the flexibility, functionality, and high-resolution needed to solve battery power characterization problems, including those associated with leakage current, in-rush current, power consumption, battery reserve capacity, and battery internal resistance. The NI PXIe-4081 shown in Figure 1a, functions as a full-featured 26-bit (7 ½ digit) digital multimeter or a 1.8 MS/s digitizer. Current measurement capability extends down into the picoamp (10-12A) range. These functions are key to performing full battery characterization tests.
Figure 1b shows a PXI system with several modular instruments in PXI form factor, such as an RF down-converter, a high-speed digitizer (oscilloscope), a digital multimeter and a dynamic-signal analyzer. The user programs these PXI virtual instruments directly and can exchange data with them taking advantage of the high-speed underlying PCI bus.
Figure 1: NI PXIe-4081 DMM inserted into a PXIe chassis with other modular instruments
Leakage Current and Power Consumption of a Portable Device
Characterizing leakage and power consumption helps design engineers determine and optimize the performance of their circuitry.
Leakage Current Measurements
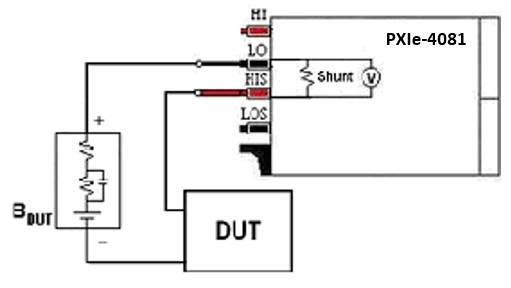
Leakage current is the amount of current the load device drains from the battery while the device is in the off state. Characterizing leakage current can tell the designer how long the battery will last while the device is not being used. To perform this measurement you need to connect the battery in series with a sensitive current measurement device such as the PXIe-4081, which offers picoamp current sensitivity, as shown in Figure 2.
Figure 2: To measure leakage current and current transients, the FlexDMM is configured as a current meter and connected in series between the Device Under Test (DUT) and its battery (BDUT).
Power Consumption Measurements
Trending the device’s power consumption helps predict battery life and optimize the electrical design. To measure the power consumption of portable battery-powered devices you could simultaneous require signals from a voltage digitizer and a current digitizer. High-resolution current digitizing is a function which is not available in traditional digital multimeters. However, you can configure the NI PXI-4081 DMM to operate as a 1.8 MS/s current digitizer. This capability allows you to use the same measurement device and physical connections shown in Figure 2 to acquire both leakage current and current transients. If you also wanted to acquire the voltage transients, you could add another PXIe-4081 configured as a 1.8MS/s voltage digitizer connected to the output of the battery, and configure both DMMs to start acquiring data at the same time [1,2].
If the battery voltage is not expected to change significantly across the load range, a single digitizer could be used to measure the current transients. The power can then be calculated from the measured current and the assumed constant voltage.
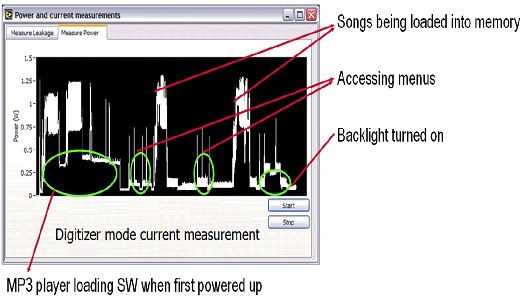
Let's examine the power consumption of a simple consumer electronic device: an MP3 player. Figure 3 depicts the power consumption measurements taken from this type of device. The measurement was made using a PXIe-4081, NI LabVIEW graphical programming environment, and NI-DMM instrument driver software for measurements and analysis. This particular MP3 player tries to maintain low power consumption at all times, even while playing songs. It only requests power from the battery when the user browses through the menus or when it loads songs into memory; and when it does so, it draws substantial spikes of current.
Figure 3: Measuring the Power Consumption of an MP3 player using the NI FlexDMM and NI LabVIEW Software.
Battery Characterization
By characterizing a variety of batteries, engineers can choose one with appropriate internal resistance so it can deliver the instantaneous current their portable device needs, in the smallest possible size. Engineers are also interested in measuring the reserve capacity of batteries. The power provided by batteries is the result of an electrochemical process, and thus the value of these two parameters will vary depending on many factors, such as measurement method, temperature, age, and manufacturing process.
Reserve Capacity Measurement
The reserve capacity of a battery is a measure of the amount of energy the battery can store. It is commonly measured by discharging the battery at a specific rate and measuring how long it takes for the voltage of the cell to drop to a specific value. The value varies depending on the cell’s chemistry type. Usually battery manufacturers rate their batteries at a discharge rate of 1C, which means that if a battery rated at 1000mAh has a 100% reserve capacity it should be able to provide 1000mA for 1 hour. If, for example, this battery had only lasted for 45min with a 1000mA load, its reserve capacity would have been 75%. The reserve capacity value is lower the higher the load, and varies depending on other factors, as mentioned above.
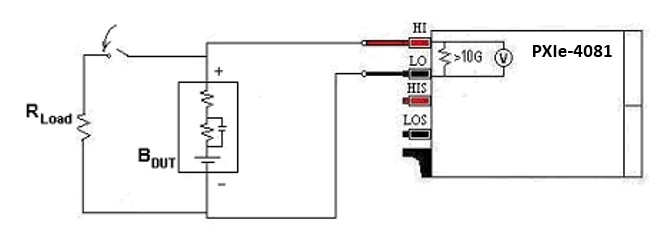
To measure the reserve capacity, you need to apply a load to the battery that corresponds to a specific discharge rate and take precision voltage measurements over an extended period of time. To perform this measurement with the DMM, you need to configure it as a digital multimeter in DC voltage mode and connect it directly at the battery terminals, as shown in Figure 4.
Figure 4: To measure voltage changes in the Battery Under Test (BDUT), the PXIe-4081 DMM is configured as a voltage precision meter and connected directly at the battery terminals. To measure reserve capacity, the load is connected for an extended period of time, and the DMM acquires data continuously.
Internal Resistance Measurements
The internal resistance of the battery determines its capability to deliver instantaneous current. The lower its value, the better it can respond to sudden current demands, such as when the MP3 user changes songs. The value of internal resistance of batteries is usually in the order of milliohms (mΩ), although some cells have micro-ohm (µΩ) level internal resistance. The internal resistance of batteries is not constant, but varies dynamically with the load connected to it. This resistance also increases with temperature and age, and even varies between cells of the same type due to materials used and the manufacturing process.
An increase of internal resistance can correlate to a performance drop. To determine when the battery needs to be replaced, some engineers are interested in monitoring the percentage increase of the battery’s resistance with respect to the value they measured when the batteries were fresh. Other engineers are interested in determining whether the battery will be able to provide enough peak current for their application. In both cases, engineers will get the most meaningful information by measuring it under the conditions that most closely resemble the way the device loads the battery.
To better understand the behavior of batteries, electrochemical models are used. The model most familiar is the Randles battery model [3], which consists of an inductor L connected in series with a resistor R1 and with a parallel network made up of another resistor R2 and a capacitor C, as shown in Figure 5. In applications like the one shown in Figure 3, load response at low frequencies is a concern. In this case, the effect of the inductance can be ignored and total battery resistance, R1 and R2, must be considered.
Figure 5: Randles battery model
Traditionally, the internal resistance of batteries has been measured by applying at the terminals of the battery either a high DC current source or an AC source at 1kHz and measuring the voltage response.
The DC current source method requires the use of a load current on the order of several amps to produce a voltage drop on R1+ R2 big enough so it can be measured. This measurement method is susceptible to 1/f noise, so using low current signals would produce a voltage drop close to the noise floor. The value of R1+ R2 is calculated by dividing the voltage difference before and after applying the current by the current magnitude.
The AC method applies an AC current signal usually at 1kHz, which makes the measurement less susceptible to 1/f noise. This method uses lower current amplitudes than the DC current source method but, in the case of the Randles model, is only sensitive to the series resistance R1. C is fairly large for many cells, from thousands of microfarads to farads depending on the cell type and capacity. Therefore, at high frequencies its reactance is small and the effect of R2 is masked. This measurement method is useful when monitoring the percentage increase of the battery’s resistance with respect to the value measured when the batteries were fresh.
You can build this test system using a signal generator and a PXIe-4081 DMM. Figure 6 shows the connections and components needed to use a high-speed voltage generator as a current source. This particular source, an older NI signal generator module, has a 50 output impedance. The battery should behave practically like a short, so by connecting a 100 resistor to the output and configuring the source to output a 1V @ 1kHz signal, the signal generator module generates a current of 6.6mA @ 1kHz. The 33uF capacitor is used to block the DC signal. The DMM is connected directly at the battery terminals and configured as a voltage digitizer in its most sensitive range. The internal resistance is calculated as the ratio between the RMS value or FFT magnitude at 1kHz of the voltage and current source waveforms.
Figure 6: Measurement components and connections needed to measure internal resistance using the AC method. The voltage source is used as a current source by adding a resistor at the output (the capacitor at the output is used to block the DC signal). The PXIe-4081 DMM is configured as a voltage digitizer with AC coupling enabled and connected at the battery terminals. The internal resistance is computed programmatically as the ratio between the RMS or FFT value at 1kHz of the voltage and current waveforms.
The internal electrochemical processes of modern cell technologies (Akaline, Lithium Ion, Nickel Metal Hydride, etc.) will have models slightly different than the Randles model, which further complicates measurements made with the AC method. Results obtained using the 1kHz method may be difficult to correlate to the actual application.
The measurement example described below takes into consideration that many consumer electronic devices maintain a light load while the device is powered up, and occasionally apply higher loads when the user accesses features, as shown previously in Figure 3. To replicate this condition, the test system pre-loads the battery with a light load (for example, 1mA) for a period of time, then applies a higher load (for example, 100mA) and measures the voltage drop caused by this additional load. The internal resistance is calculated from the load values and resulting voltages. This measurement method is used by some battery manufacturers, like Energizer [4], to characterize the internal resistance of their batteries.
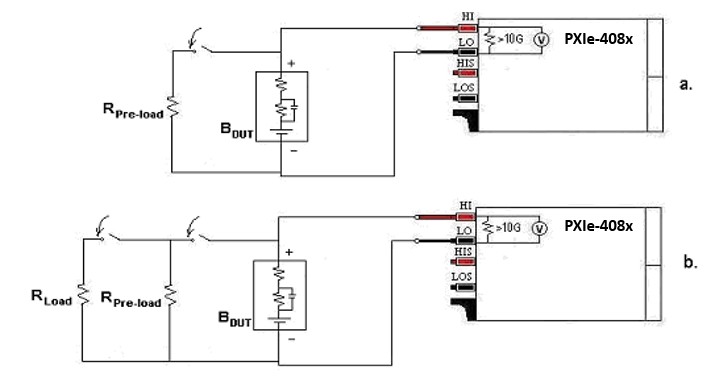
You can build this measurement system using the same software-centered system, and adding a programmable switch matrix for connecting different resistive loads to the battery. Then you can simply measure the voltage drops at the battery terminals with the digital multimeter. The connections between the FlexDMM, the battery under test and the loads are shown in Figure 7.
Figure 7: a. A pre-load is connected to the battery, simulating the case where the battery is in a circuit that applies a constant background load. The voltage at the battery terminals is measured with the FlexDMM configured to measure DC Volts with an input impedance of more than 10G. b. A second load is connected in parallel to cause a voltage drop. Internal resistance is derived by dividing the voltage drop by the current flowing in RLOAD.
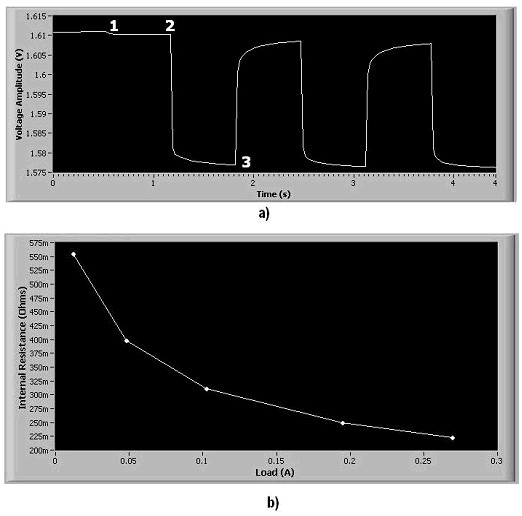
Figure 8a depicts the voltage drops caused by applying the load. Point 1 corresponds to the moment where a 1mA pre-load is connected to the battery. Point 2 corresponds to the moment where the 100mA load is connected and point 3 to the moment where this load is removed. To compute the internal resistance (RI), divide the difference in voltage by the difference in current between points 2 and 3. The current at point 2 (I2) is equal to the voltage (V2) divided by the resistance of the pre-load (RPL), and the current at point 3 (I3), to the voltage (V3) divided by the load (RL).
RI = ΔV/ΔI where
ΔV = V2 - V3
ΔI = I2 – I3 = (V2/RPL) - (V3/RL)
Using pairs of pre-loads and loads you can measure the internal resistance of the battery under different loads. Figure 8b shows the internal resistance of a D-size battery with a pre-load of 1mA and loads of 10mA, 44mA, 95mA, 180mA, and 265mA.
Figure 8: a) Voltage drops caused by a 100mA load over a 1mA pre-load on a D-size battery. b) Internal resistance of a D-size battery vs load. A pre-load of 1mA was used. Loads of 10mA, 44mA, 95mA, 180mA and 265mA were used.
Small signal measurements of the internal resistance can be measured by applying a high pre-load (for example 100mA) and then a small additional load (for example 1mA). This time the voltage drop caused by the second load will be small—perhaps in the range of a few tens of microvolts. To detect this small voltage, use a power supply or a sample battery of the same type that you are testing as a reference voltage to “null” the battery under test and measure the voltage difference between the battery and the reference voltage signal, as shown in Figure 9. This allows the digital multimeter to be set to its most sensitive range.
Figure 9: Connections for small signal measurements. The FlexDMM can now be configured for its more sensitive DC Volts range.
Simplifying Test System Development
Engineers are interested in characterization of power consumption and battery performance because they are ubiquitous. When testing batteries, engineers will get the most meaningful information by making their tests under the conditions that most closely resemble the way the electronic device loads the battery.
Design Engineers are challenged to adapt existing test equipment to meet these emerging test requirements. Test equipment manufacturers, such as National Instruments, are responding to this trend by providing engineers with the software tools required to build measurement systems that suit their needs exactly, instead of being limited by traditional fixed-function instruments that are vendor-defined. This software-centered approach is called virtual instrumentation.
Using virtual instrumentation gives engineers the power to create and define these test systems tailored exactly to match the way the battery will be used. By providing a broad measurement set coupled to flexible software to replicate the application, nearly every form of battery and load characterization can be addressed with the same system.
References:
[1] Measure Real Power with a Digital Multimeter
[2] LabVIEW Example Program: "Use the FlexDMMs' 1.8 MS/s Digitizer Capability to Make Power Measurements"
[3] B HARIPRAKASH S K MARTHA and A K SHUKLA. Monitoring sealed automotive lead-acid batteries by sparse-impedance spectroscopy. Proc. Indian Acad. Sci. (Chem. Sci.). Vol. 115. Nos 5 & 6. October–December 2003. pp 465–472. Indian Academy of Sciences
[4] Energizer Cylindrical Alkaline - Application Manual. Page 7 and 8 - Internal Resistance.
