SPICE Analysis Fundamentals
Overview
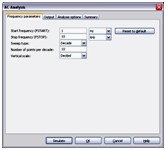
Multisim simplifies the procedure for an advanced analysis by providing a configuration window. This abstracts away the complexities associated with SPICE syntax and configuration of an analysis. With this window you merely need to specify the parameter values and output nodes of interest.
The National Instruments SPICE Analysis Fundamentals Series is a free resource that provides you with step-by-step tutorials on how to configure and run the different SPICE analyses available in Multisim.
Contents
- DC Operating Point Analysis
- DC Sweep Analysis
- Transient Analysis
- AC Analysis
- Temperature Sweep Analysis
- Fourier Analysis
- Worst Case Analysis
- Noise Analysis
- Noise Figure Analysis
- Parameter Sweep Analysis
- Additional Resources
DC Operating Point Analysis
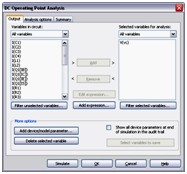
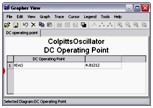
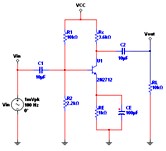
DC Operating Point Analysis calculates the behavior of a circuit when a DC voltage or current is applied to it. The result of this analysis is generally referred as the bias point or quiescent point, Q-point. In most cases, the results of the DC Operating Point Analysis are intermediate values for further analysis.
DC Sweep Analysis
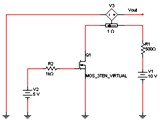
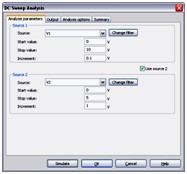
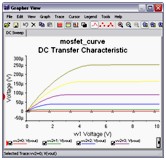
DC Sweep Analysis is used to calculate a circuits’ bias point over a range of values. This procedure allows you to simulate a circuit many times, sweeping the DC values within a predetermined range. You can control the source values by choosing the start and stop values and the increment for the DC range. The bias point of the circuit is calculated for each value of the sweep.
 |  |  |
Transient Analysis
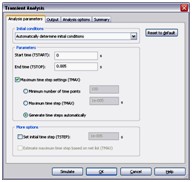
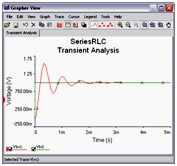
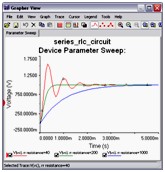
In Transient Analysis Multisim computes the circuit’s response as a function of time. This analysis divides the time into segments and calculates the voltage and current levels for each given interval. Finally, the results, voltage versus time, are presented in the Grapher View.
AC Analysis
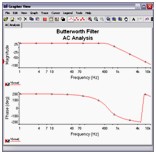
AC Analysis is used to calculate the small-signal response of a circuit. In AC Analysis, the DC operating point is first calculated to obtain linear, small-signal models for all nonlinear components. Then, the equivalent circuit is analyzed from a start to a stop frequency. The result of an AC Analysis is displayed in two parts: gain versus frequency and phase versus frequency.
Temperature Sweep Analysis
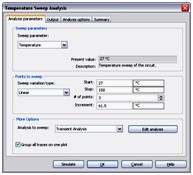
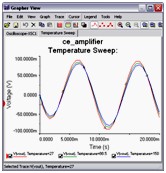
Using Temperature Sweep Analysis you can quickly verify the operation of your circuit by simulating it at different temperatures. The effect is the same as simulating the circuit several times, once for each temperature. You control the temperature values by choosing start, stop and increment values.
Fourier Analysis
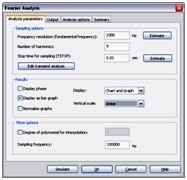
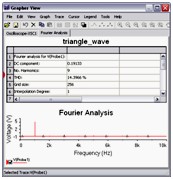
Fourier Analysis is a method of analyzing complex periodic waveforms. It permits any nonsinusoidal period function to be resolved into sine or cosine waves, possibly an infinite number, and a DC component. This permits further analysis and allows you to determine the effect of combining the waveform with other signals.
Worst Case Analysis
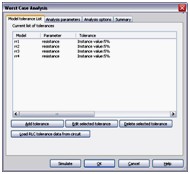
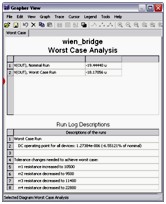
Worst Case Analysis is a statistical technique that uses a “what if” approach to provide a practical result and its primary purpose is to identify the most critical components of a circuit. This analysis helps you answer the question: What will be the worst possible effects of variations in component parameters?
Noise Analysis
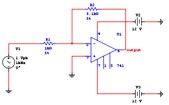
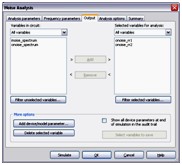
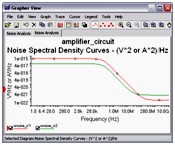
Noise Analysis calculates the noise contribution from each resistor and semiconductor device at the specified output node. Multisim creates a noise model of the circuit using noise models of each resistor and semiconductor devices and then performs AC-like analysis. It calculates the noise contribution of each component and propagates it to the output of the circuit sweeping through the frequency range specified.
Noise Figure Analysis
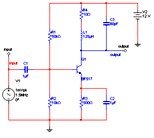
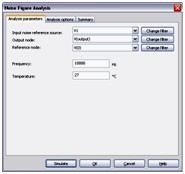
Noise Figure Analysis is used to specify exactly how noisy a device is. For a transistor, noise figure is simply a measure of how much noise the transistor adds to the signal during the amplification process. In a circuit network, the noise figure is used as a figure of merit to compare the noise in a network with the noise in an ideal or noiseless network. It is a measure of the degradation in signal-to-noise ratio (SNR) between the input and output ports of a network.
Parameter Sweep Analysis
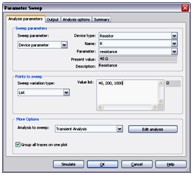
With Parameter Sweep Analysis you can verify the operation of a circuit by simulation across a range of values for a component parameter. The effect is the same as simulating the circuit several times, once for each value. You control the parameter values by choosing a start value, end value, type of sweep that you wish to simulate and the desired increment value.
