What Makes a Bus High Performance?
Overview
Contents
- Simplified Model of a Test System
- Latency and Bandwidth
- Implementation
- Application
- Conclusion
- Relevant NI Products and Whitepapers
Simplified Model of a Test System
Even in a simplified model of a test system (see Figure 1), there are many hardware and software components that can affect bus performance. In the host, the software application, operating system, CPU/RAM combination, software stacks, drivers, and hardware interface will affect bus performance. On the instrument side, the I/O hardware and firmware, CPU/RAM combination, software application and measurement speed will affect the bus performance. Changing any one of these components may change the bus performance, just like changing from one bus to another will affect overall system performance. All of these components can be categorized into one of the four main factors affecting bus performance. A lot of bus performance comparisons focuses solely on the bus bandwidth ignoring the other hardware and software components that influence actual bus performance.
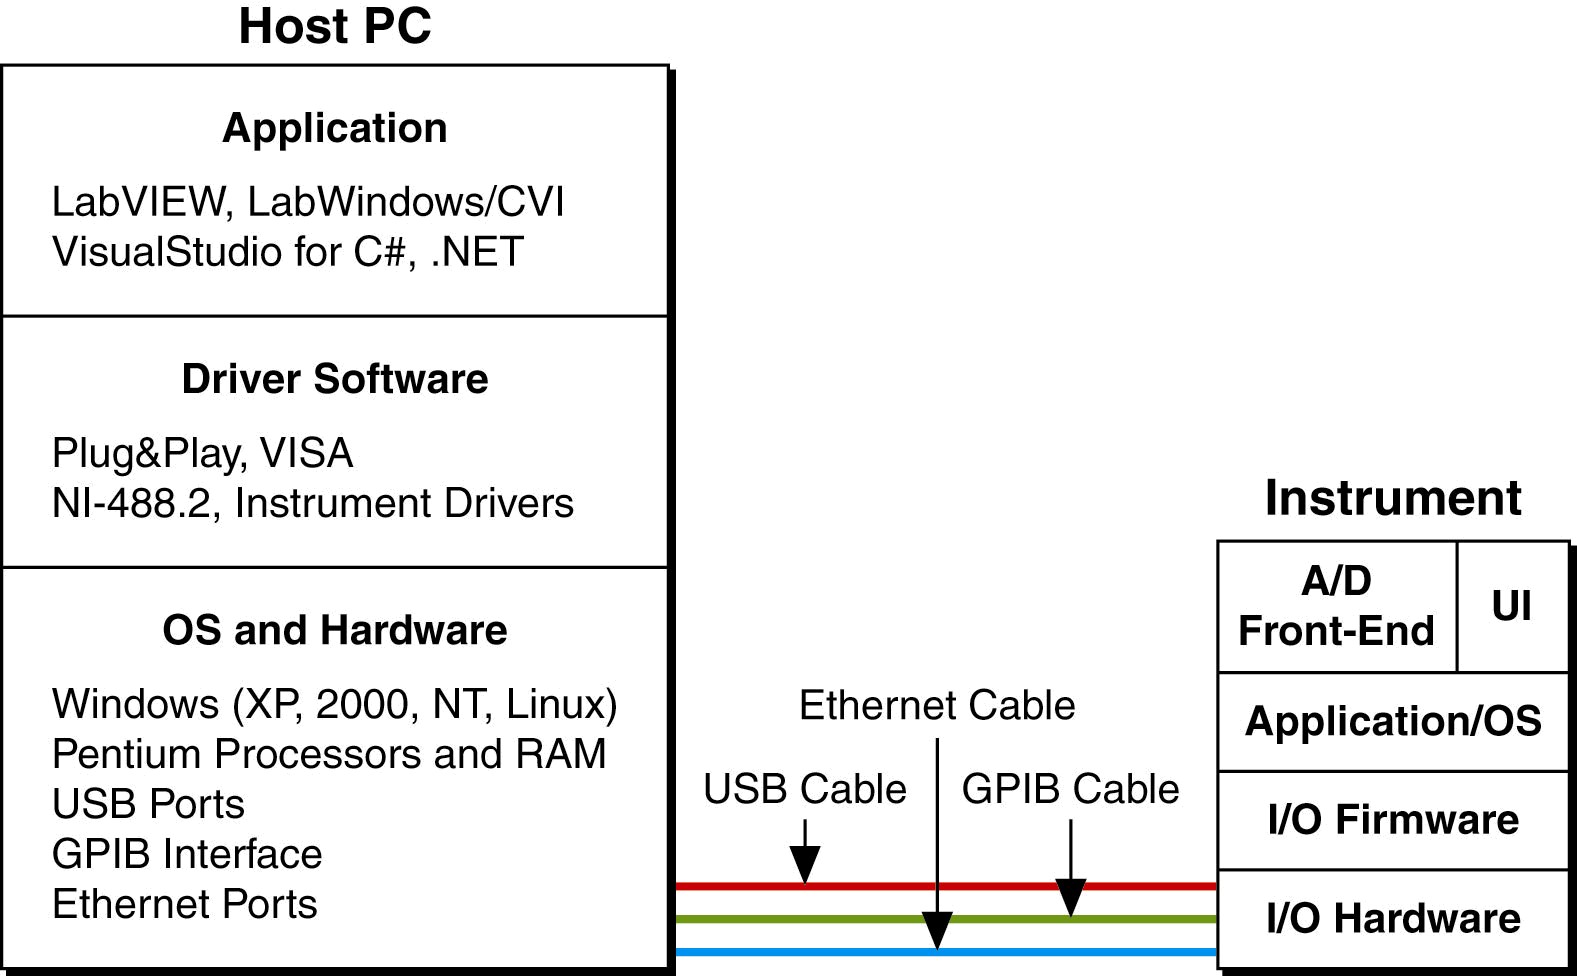
Figure 1. Host PC and Instrument System Components
The four major factors that affect bus performance are bandwidth, latency, implementation, and application. The bandwidth is the data rate. This is usually measured in millions of bits per second (Mbits/s). The latency is the transfer time. This is usually measured in seconds. For example, in Ethernet transfers, large blocks of data are broken into small segments and sent in multiple packets. The latency is the amount of time to transfer one of these packets. The implementation of the bus software, firmware, and hardware will affect its performance. Not all instruments are created equal. A PC implemented with a faster processor and more RAM will have higher performance than one with a slower processor and less RAM. The same holds true for instruments. The implementation trade-offs made by the instrument designer, whether a user-defined virtual instrument or vendor-defined traditional one, will have an impact on the instrument performance. One of the main benefits to virtual instruments is that the end user, as the instrument designer, decides the optimal implementation trade-offs.
The final major factor affecting bus performance is the application or how the instrument is used. In some applications, the measurement subsystem is the bottleneck and in others the bottleneck is the processor subsystem. Understanding which subsystem is the bottleneck provides a path to improving performance. And the key point remains that in order for a particular bus to be high performance or even usable, it must exceed the application requirements.
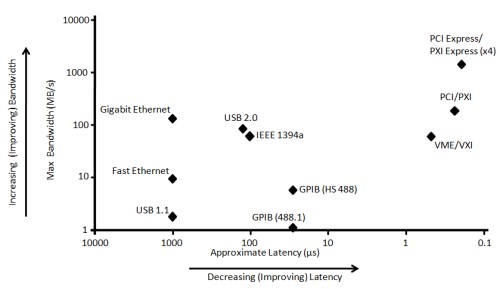
Figure 2. Theoretical Bandwidths vs. Latencies of Mainstream T&M Buses
Considering each major factor in more detail will help users to better understand the trade-offs.
Latency and Bandwidth
As mentioned to above, latency will have a profound impact on bus performance depending on the size of data transfers. The theoretical bandwidth and latency of mainstream instrument control buses (see Figure 2) provide some guidance on the relationship between bus performance and transfer size. For example, let’s look at two communication buses. Fast Ethernet has bandwidth of 100 Mbits/s which is higher than the 64 Mbits/s bandwidth of high-speed GPIB. But the latency of Fast Ethernet is much slower, in the millisecond range, than high-speed GPIB latency which is in the tens of microsecond range. Figure 3 shows the bus performance, the actual transfer rate, for multiple buses on a Tektronix 5104B scope. For data transfers that are smaller than 8 Kbytes, high-speed GPIB provides higher performance. But for transfer sizes that are larger than 8 Kbytes Ethernet provides better performance.
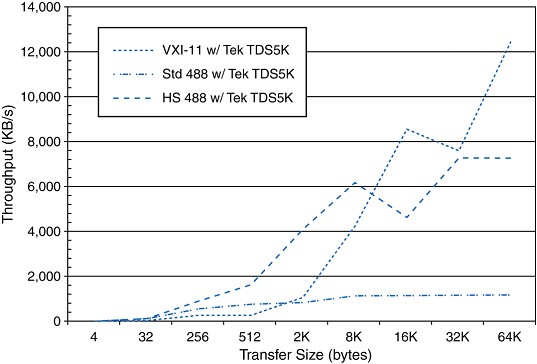
Figure 3. HS-488 has higher performance for packets less than 8 Kbytes, Ethernet larger than 8 Kbytes
The same principle that both bandwidth and latency impacts bus performance also applies when comparing communication buses to system buses. Communications buses, like GPIB, USB, and LAN, are usually used outside the PC to connect peripherals and have longer latencies and lower bandwidths. System buses, like PCI and PCI Express, are usually used inside PC and have better latencies with much higher bandwidths providing the best performance for both small and large transfer sizes. This is because data from multiple communication buses are aggregated on to system buses for processing by the host CPU. Another way of looking at it is that the primary value of communication buses is not performance, but some other factor. For example, USB makes it very easy to connect external devices and LAN is great at distributing measurement over long distances. But both of these buses are connected to the CPU and RAM by higher bandwidth and lower latency system buses.
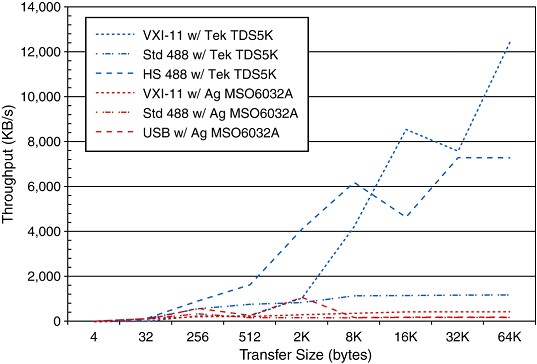
Figure 4. Implementation Differences for Same Buses Affects Performance
Implementation
Implementation is the third major factor affecting the bus performance. For example, the selection of bus interface chips, coding of the instrument firmware, using instrument drivers or software transparency, and sizing of CPU and RAM will impact the bus performance. Consider the case of standard GPIB and Ethernet bus implementations on two different scopes – one from Agilent and the other from Tektronix. The results in Figure 4 show the impact of implementation choices on bus performance. The Tektronix scope provides better performance for most transfer sizes for both standard GPIB and Ethernet. This benchmark used SCPI commands on the same PC with the same GPIB and Ethernet cables. The only difference was the instrument implementation of the GPIB and Ethernet interfaces. This is particularly problematic because most instrument vendors don’t specify bus performance for their instruments. In addition, the instrument processor type and speed, memory depth, operating system, firmware, and user-interface software all have an impact on bus performance. This means that system designer should benchmark bus performance before final instrument selection is complete.
Another large implementation impact on bus performance is whether an instrument driver is needed or not. Instrument using system buses, like PCI, PCI Express and PXI, are software transparent and do not need an instrument driver. They use Direct Memory Access (DMA) to transfer data to CPU memory without CPU intervention via a driver. Instruments that use communication buses use one or more drivers that require CPU intervention via unique host software stacks to transfer data to CPU memory. These software stacks add delays and jitter to the data transfer timing because they require extra processing and are subject to operating system priorities. In some cases, like TCP/IP, the software stack can consume a significant portion of the processor capacity. Also, software transparency should not be confused with bus transparency using bus agnostic drivers like VISA drivers. With VISA drivers, the extra CPU processing overhead provides the ability to easily or ‘transparently’ switch between communication buses. For these performance reasons, it is better to keep the measurements as close to the CPU as possible using software transparent system buses.
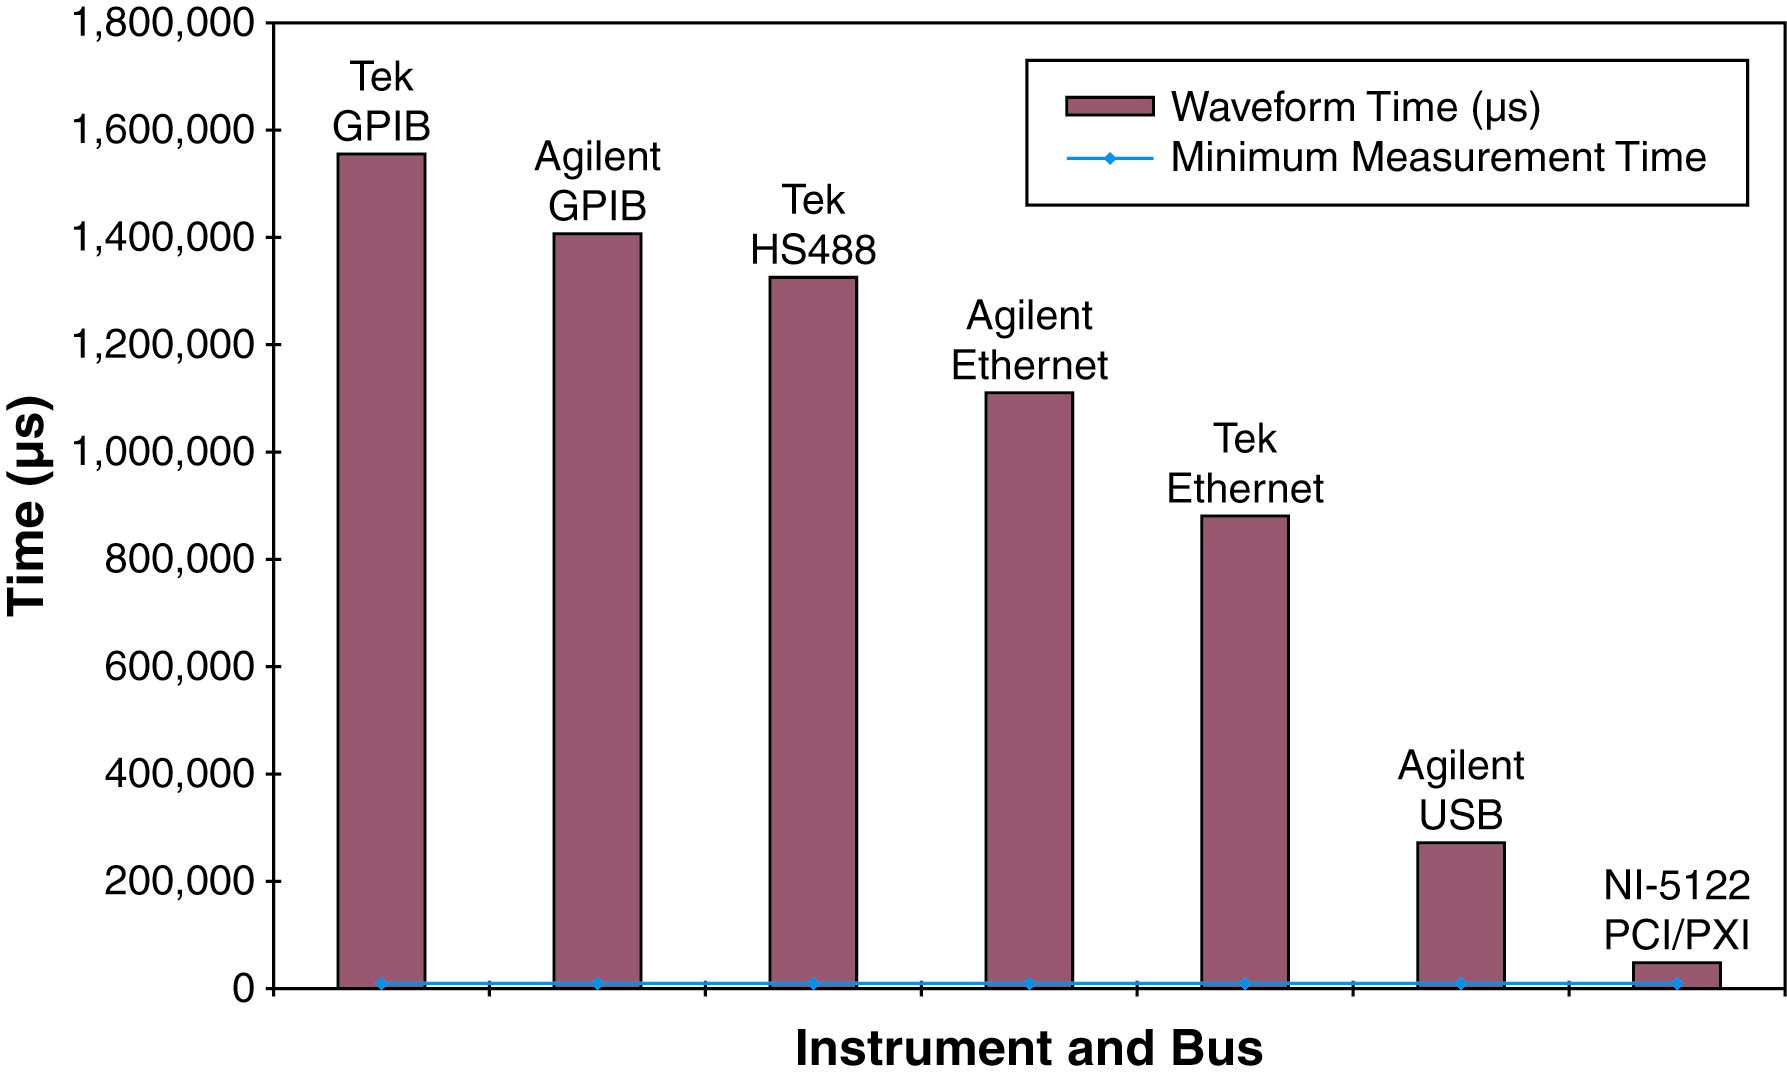
Figure 5. System buses, like PCI and PXI, provide better performance in measuring and transferring 1 million samples.
Application
The last major factor in making a bus high performance is the application of the instrument in the system. Some applications require a lot of data processing, like computing FFTs and transferring large waveforms while others may only look for minimum or maximum values. In computation-intensive or time-sensitive applications, the processor becomes the bottleneck. In these applications, instrument based on system buses like PCI, PCI Express and PXI will provide a better solution because they are software transparent, have better latencies and higher bandwidth (see Figure 5.). In measurement intensive applications, where the time to complete a measurement is relatively long compared to the processing time, than the measurements completion is usually the bottleneck. In these applications, any bus will do and the instrument selection falls to other criteria like measurement speed, accuracy, precision, distance, cost, or size.
From the analysis of the four major factors – bandwidth, latency, implementation, and application, there are several system design ‘best practices’ worth considering. The first is to keep the measurements as close to the CPU as possible. This takes advantage of the software transparency and low latency of system buses while reducing the extra delays in measurement timing and load on the processor. The second best practice is to use software designed to support any bus, like VISA, LabVIEW and LabWindows/CVI. Not only does this software help ‘future proof’ the test system, it also makes the inevitable mid-life upgrades easier to implement. Finally, benchmark the bus performance of potential instruments before making the final selection. As shown in Figures 3 and 4 above, the actual implementation on performance varies greatly and may have a large impact on system performance.
Conclusion
In conclusion, look beyond the bandwidth of a particular instrument bus to gauge expected performance. What makes a bus high performance is the combination of latency, bandwidth, implementation and application of the instrument. These factors will impact whether an instrument bus exceeds required performance. Use benchmarks to compare actual performance between potential instruments. And finally, architect the test system to support multiple buses. This makes reuse and mid-life upgrades easier.
Relevant NI Products and Whitepapers
National Instruments, a leader in automated test, is committed to providing the hardware and software products engineers need to create these next generation test systems.
Software:
Hardware:
- Modular Instruments (Oscilloscopes, Multimeters, RF, Switching, and more)
- Multi-function Data Acquisition
- PXI System Components (Chassis and Controllers)
- Instrument Control (GPIB, USB, and LAN)
Test System Development Resource Library
National Instruments has developed a rich collection of technical guides to assist you with all elements of your test system design. The content for these guides is based on best practices shared by industry-leading test engineering teams that participate in NI customer advisory boards and the expertise of the NI test engineering and product research and development teams. Ultimately, these resources teach you test engineering best practices in a practical and reusable manner.
