Anti-Aliasing Filters and Their Usage Explained
Overview
Introduction to Anti-Aliasing Filters
According to the Nyquist sampling theorem, the sampling rate should be at least twice the maximum frequency component of the signal of interest. In other words, the maximum frequency of the input signal should be less than or equal to half of the sampling rate.
How do you ensure that this is definitely the case in practice? Even if you are sure that the signal being measured has an upper limit on its frequency, pickup from stray signals (such as the powerline frequency or from local radio stations) could contain frequencies higher than the Nyquist frequency. These frequencies may then alias into the appropriate frequency range and thus give you erroneous results.
To be sure that the frequency content of the input signal is limited, a low pass filter (a filter that passes low frequencies but attenuates the high frequencies) is added before the sampler and the ADC. This filter is an anti-alias filter because by attenuating the higher frequencies (greater than the Nyquist frequency), it prevents the aliasing components from being sampled. Because at this stage (before the sampler and the ADC) you are still in the analog world, the anti-aliasing filter is an analog filter.
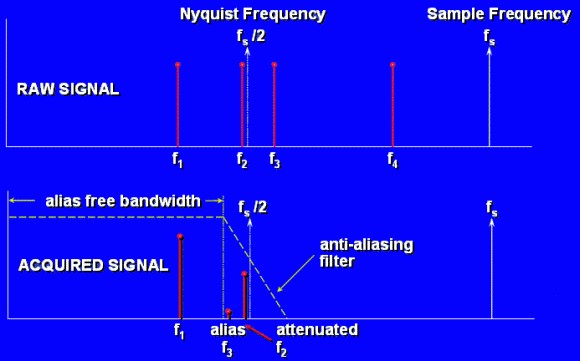
An ideal anti-alias filter passes all the appropriate input frequencies (below f1) and cuts off all the undesired frequencies (above f1). However, such a filter is not physically realizable. In practice, filters look as shown in illustration (b) below. They pass all frequencies < f1, and cut-off all frequencies > f2. The region between f1 and f2 is known as the transition band, which contains a gradual attenuation of the input frequencies. Although you want to pass only signals with frequencies < f1, those signals in the transition band could still cause aliasing. Therefore in practice, the sampling frequency should be greater than two times the highest frequency in the transition band. This turns out to be more than two times the maximum input frequency (f1). That is one reason why you may see that the sampling rate is more than twice the maximum input frequency.
As an example, an audio signal contains frequency component up to 20 KHz. The Nyquist sampling theorem states a required sampling frequency of 40 Khz. The anti-aliasing would have a cut-off frequency of 20 KHz, but since this is not an ideal filter usually the sampling frequency used goes from 44.1 KHz to 96 KHz, allowing a transition band of at least 2 KHz.
An illustration of an anti-aliasing filter being applied to a raw signal is shown below. Say that you want to sample f1 and f2 only. Note that f3 lies in the transition band of the filter. Thus, the undesired frequency f3 has been attenuated but its attenuated image still is sampled. Note also that f4 has been completely eliminated because it lies above the transition band.

