View Test Results Using the FlexLogger™ TDMS Viewer
Overview
FlexLogger is application software for quick sensor configuration and data logging of mixed signals to verify electromechanical systems. FlexLogger features an integrated TDMS Viewer, which you can use to gain engineering insights from your captured data. This white paper discusses capabilities of the TDMS Viewer included with FlexLogger.
Contents
- FlexLogger File Format
- View Data From Multiple Channels in One Place
- Customize the View to See Exactly What You Need
- Synchronize CAN Data with Other Measurements
- Export Data to Multiple File Formats
- DIAdem: The NI Solution for Post-Processing Measurement Data
- Next Steps
FlexLogger File Format
FlexLogger uses the Technical Data Management Streaming (TDMS) file format. NI introduced the TDMS file format because of the deficiencies of other data storage options commonly used in test and measurement applications. The binary TDMS file format is an easily exchangeable, inherently structured, high-speed-streaming-capable file format that enables the addition of metadata to files.
| ASCII | Binary | XML | Database | TDMS | |
|---|---|---|---|---|---|
| Exchangeable | |||||
| Small Disk Footprint | |||||
| Searchable | |||||
| Inherent Attributes | |||||
| High-Speed Streaming | |||||
| NI Platform Supported |
* May require a toolkit or add-on module.
Figure 1: The TDMS file format combines the benefits of several data storage options in one file format.
FlexLogger adds metadata to TDMS files generated automatically while leaving room to add custom metadata. Adding metadata to files is a key foundation for proper data management, enabling efficient search, viewing, analysis, and reporting of data after it’s collected.
View Data From Multiple Channels in One Place
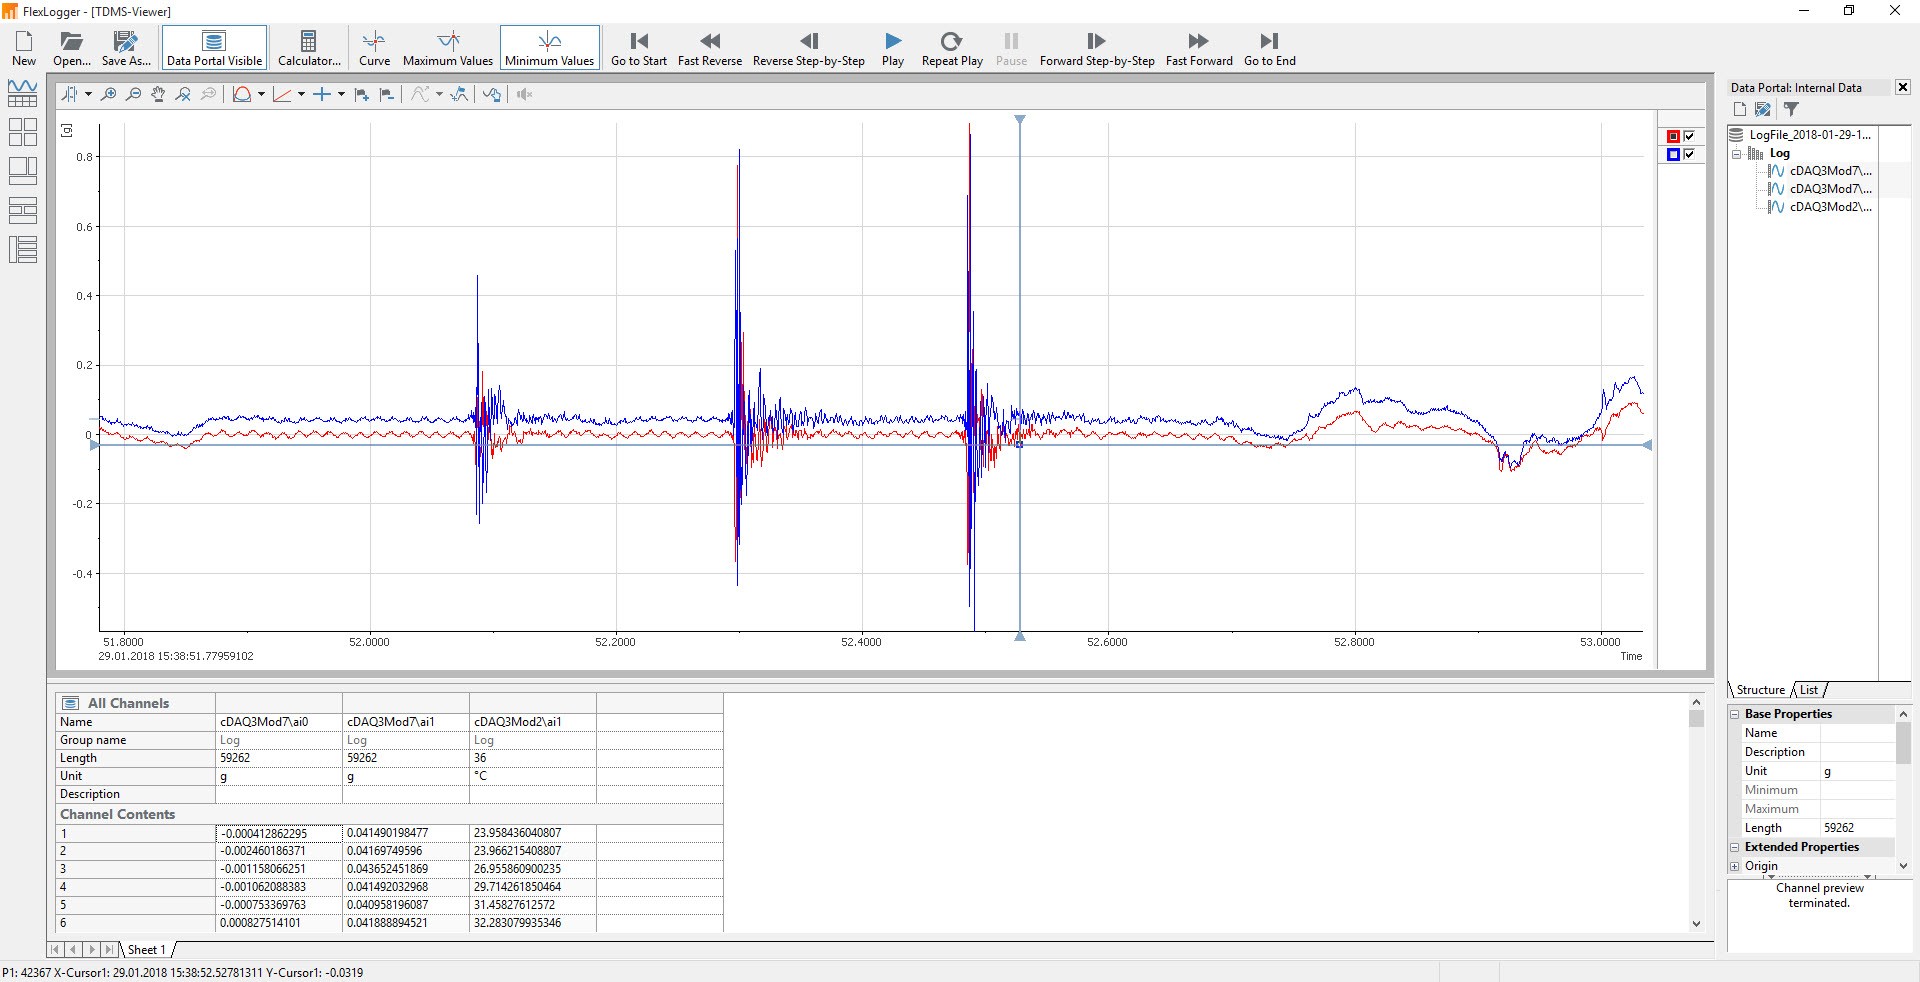
When a TDMS file is opened in the FlexLogger TDMS Viewer, you can view waveforms collected in one or multiple graphs. Simply choose one or multiple channels of data you want to view in the data portal, and then drag them to the wanted graph. All waveforms are automatically aligned based on their timestamps for easy playback and synchronization. After waveforms are plotted, you can use scroll and zoom cursors to identify peaks and features in your data or to graphically delete, fit, or copy ranges of data.
Figure 2: Drag Channels over from the Data Portal to the 2D Graph to see multiple waveforms in one graph.
Customize the View to See Exactly What You Need
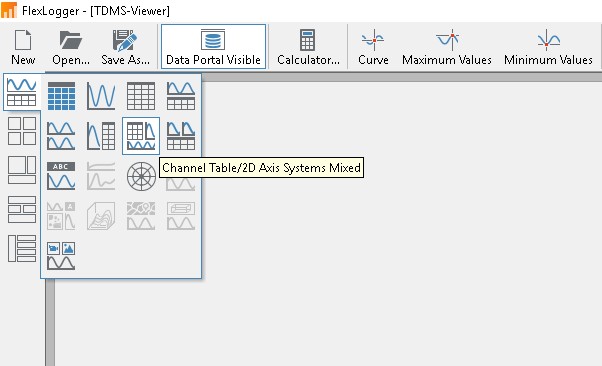
Different projects often require different ways of viewing your data to extract the correct insights. With the FlexLogger TDMS Viewer, you have complete control over the number of graphs and charts you see. You can use the preconfigured layouts on the left-hand toolbar or create your own layout by right-clicking an area and selecting New Area. Each area can be set up to display a 2D axis system, polar plots, or channel table. Properties for each area can also be changed from the right-click menu.
Figure 3: Use preconfigured layouts or customize your own layouts to view data in the FlexLogger TDMS Viewer.
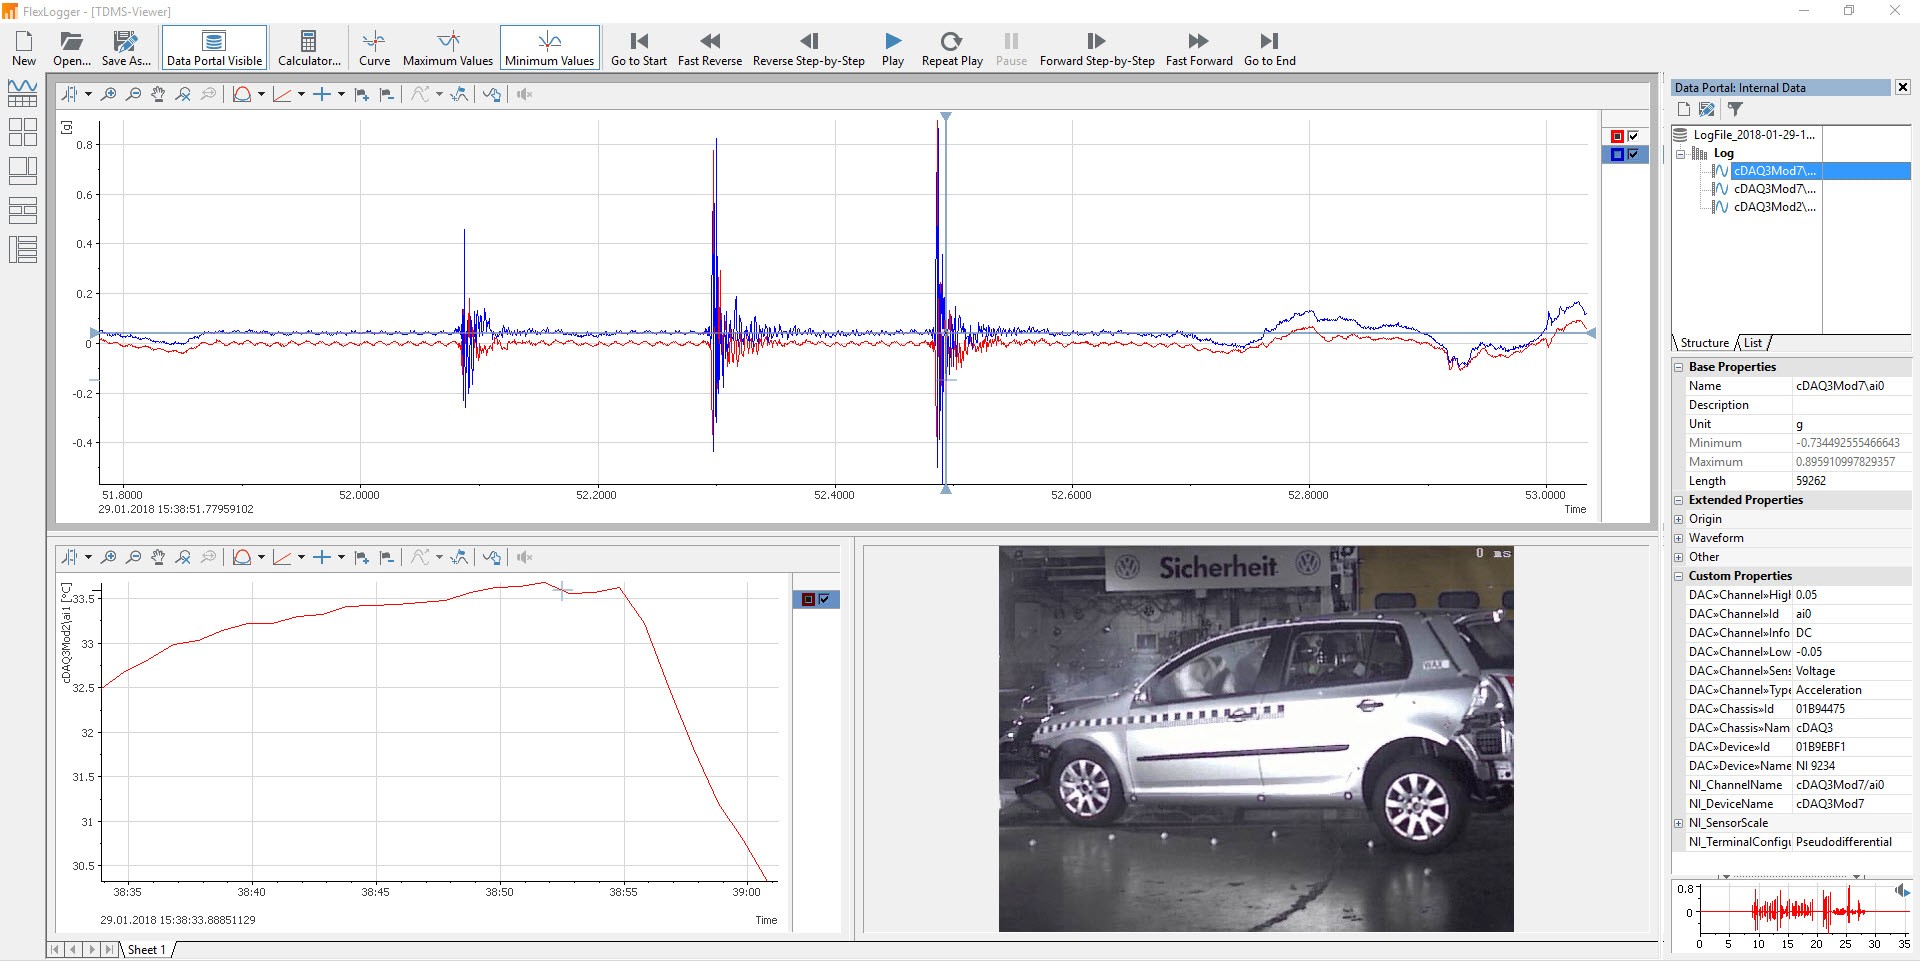
Photos and videos are now often added to tests to provide another data point. With the FlexLogger TDMS Viewer, you can view photos and videos right next to data collected. You can synchronize videos together with data to easily view visual cues that happen during testing.
Figure 4: Synchronize data and videos together during playback using the FlexLogger TDMS Viewer.
Synchronize CAN Data with Other Measurements
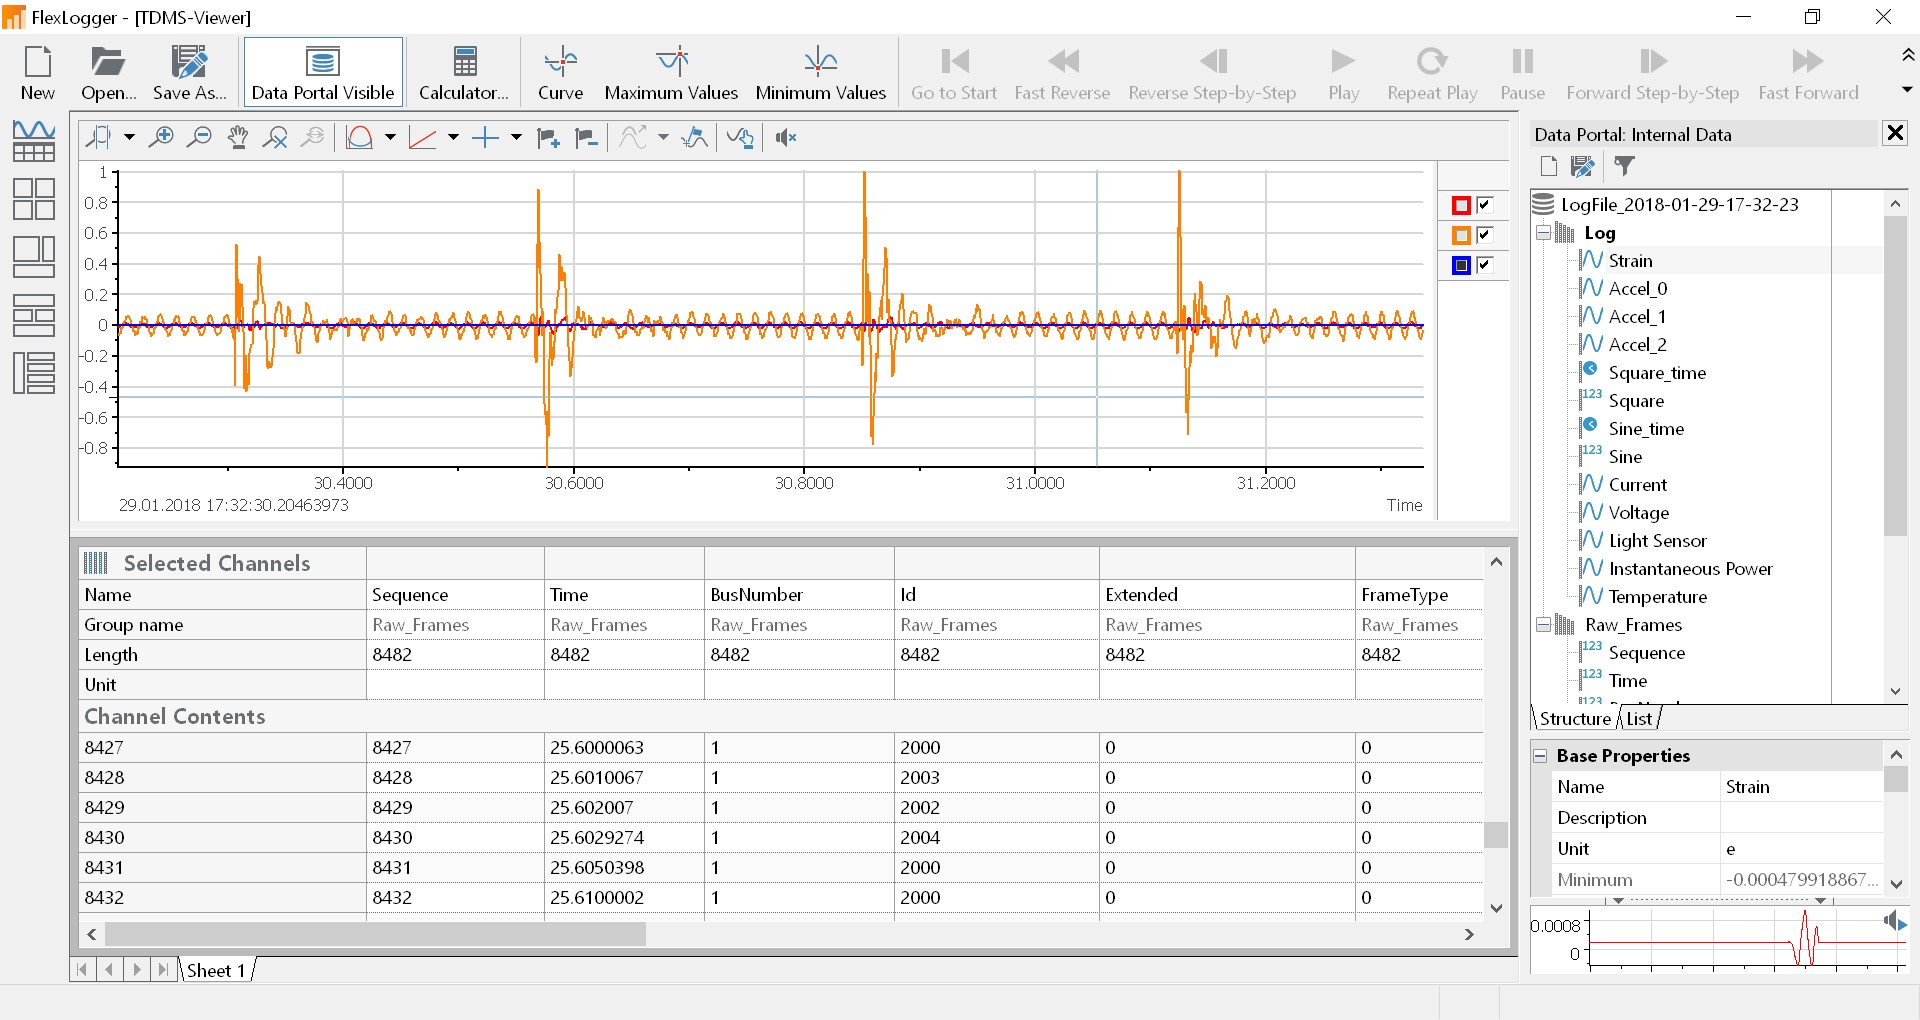
FlexLogger takes the hassle out of synchronizing CAN data with other measurements collected during testing by automatically assigning timestamps to CAN frames. When viewing CAN data with the FlexLogger TDMS Viewer, having these timestamps allows CAN signals to be synchronized with all other data being viewed.
Figure 5: View CAN data alongside other data in the FlexLogger TDMS Viewer.
Export Data to Multiple File Formats
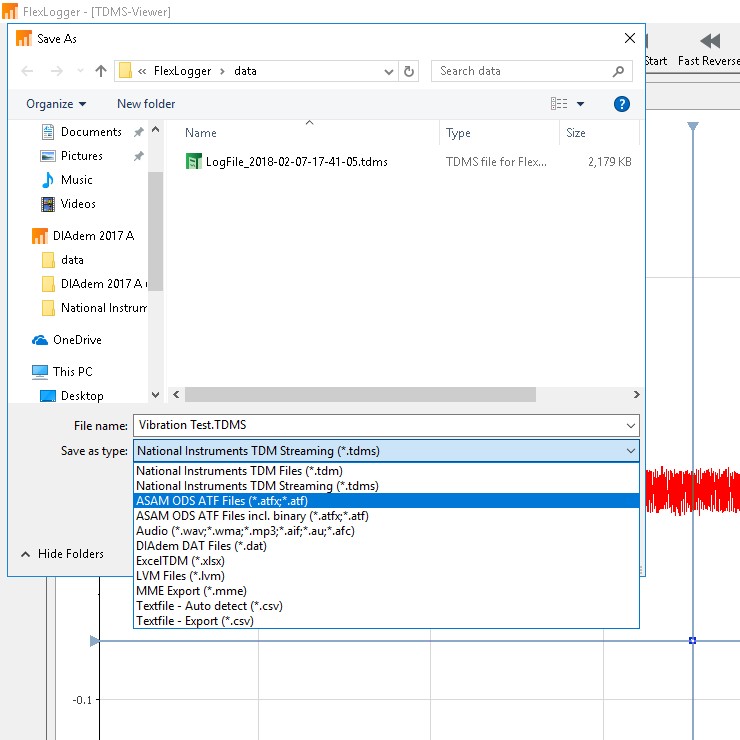
FlexLogger data is originally saved in the TDMS file format, a binary file format that was built specifically for data acquisition applications. There usually comes a time, though, when files need to be exported to work with other software packages. You can export your data into multiple formats like Excel (.xlsx), text (.csv), DIAdem data files (.dat), LabVIEW measurement files (.lvm), or more advanced file formats like ASAM ODS ATF.
Figure 6: Export data to multiple files formats like .xlsx with the FlexLogger TDMS Viewer.
DIAdem: The NI Solution for Post-Processing Measurement Data
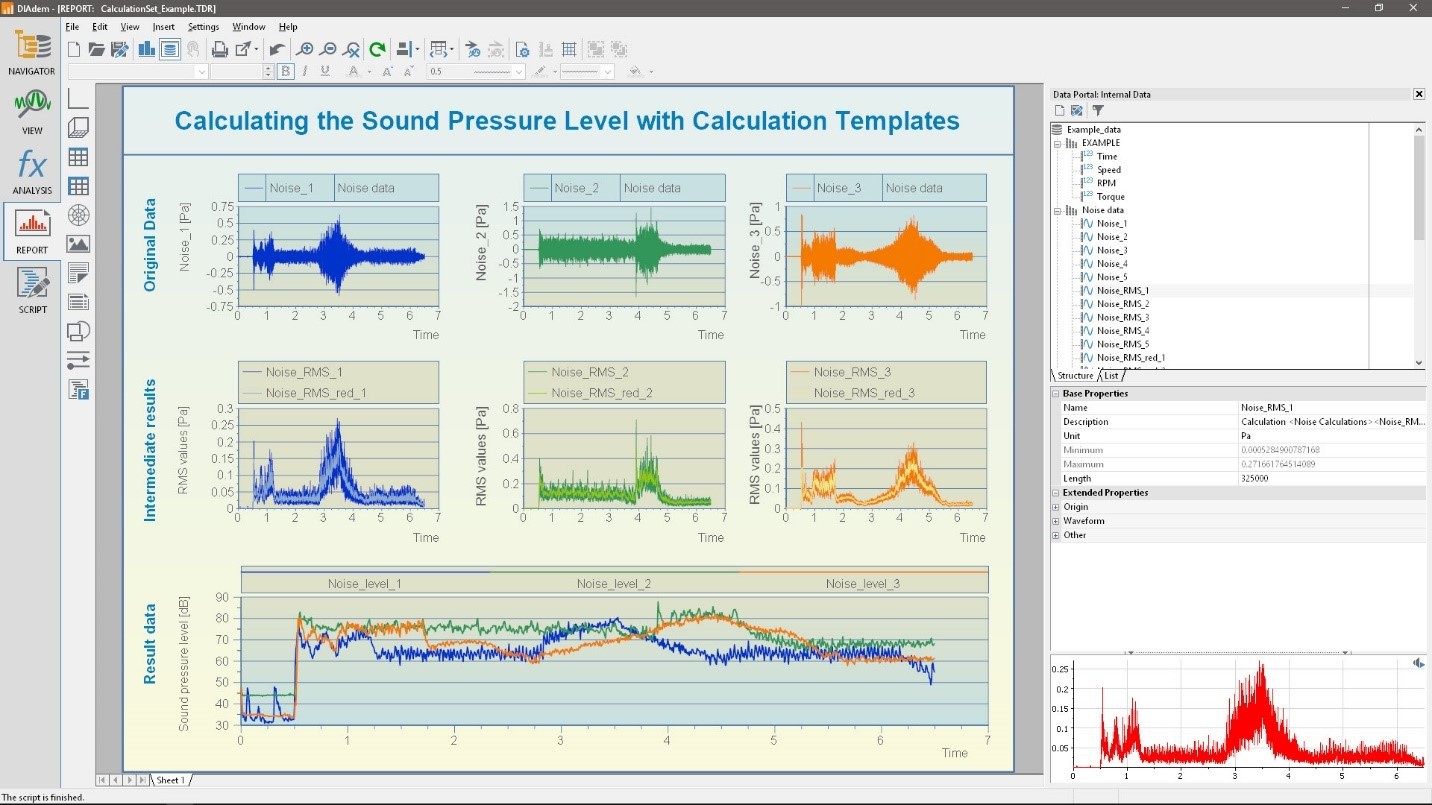
The FlexLogger TDMS Viewer is built on DIAdem, software that gives you the ability to easily search for, inspect, analyze, and report on measurement data. All activities in DIAdem can be used interactively with the click of a mouse or automated to reduce errors and save time in processing data. Because the FlexLogger TDMS Viewer shares core building blocks of DIAdem, the full version of DIAdem works seamlessly with FlexLogger, allowing data to be opened from FlexLogger directly into DIAdem.
Figure 7: With DIAdem, you can quickly locate, inspect, analyze, and report on measurement data.
Next Steps
- Learn more about FlexLogger.
- Download the free FlexLogger evaluation.
- Learn more about DIAdem.
