Expand Test Coverage and Integration with FlexLogger™ Software Extensibility
Overview
As product functionality increases, data-logging systems are facing usability challenges to integrate the latest technologies, including a high mix of different sensors and specialty instrumentation. You need software tools that deliver flexibility without compromising efficiency. NI introduced FlexLogger software to increase efficiency by simplifying configuration and delivering common measurements out of the box, without losing the ability to extend with plug-ins.
In this white paper, see how you can extend the functionality of FlexLogger software to integrate third-party I/O, custom sensors, and communication with external systems to supplement your NI data acquisition system.
Contents
- FlexLogger Software Architecture
- Integrating Custom I/O
- Communicating with External Systems and Applications
- Remote Visualization
FlexLogger Software Architecture
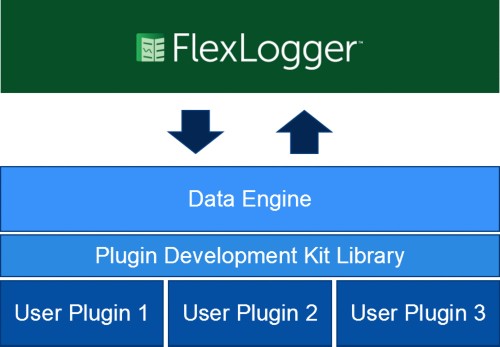
The FlexLogger software environment provides the user interface that communicates with the data engine, which controls data acquisition and logging-task execution. There are two key interfaces you can use to communicate with external systems, instrumentation, and other custom I/O.
FlexLogger Plug-Ins
The FlexLogger Plugin Development Kit (PDK) exposes a set of classes and methods that provide an interface to the underlying data engine. You can use this interface with the same workflow to acquire, control, analyze, and log data from third-party I/O within the FlexLogger software environment alongside your analog, digital, and vehicle-communication signals from NI data acquisition hardware.
Figure 1: FlexLogger plug-ins access the same data engine as NI data acquisition hardware.
SystemLink™ Software Tags
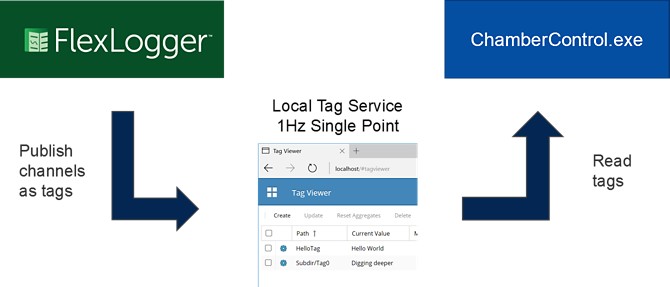
SystemLink software data services tags are scalar, nondeterministic, single-point values used to send and receive data across systems. The FlexLogger data engine produces and consumes SystemLink software tags, which you can use to track data and interact with external applications, such as sending and receiving setpoints to a stand-alone LabVIEW executable running a temperature chamber execution.
Integrating Custom I/O
How Do I Add and Configure Custom Plug-Ins in FlexLogger Software?
You can build plug-ins using LabVIEW 2019 64-bit to communicate with third-party instrumentation and custom sensors via interfaces such as GPIB, serial, Ethernet, and USB. You can build plug-ins that:
- Produce data for FlexLogger software, such as acquiring data from an RS232 pH sensor
- Consume setpoint data from FlexLogger software to control a third-party instrument such as a programmable power supply
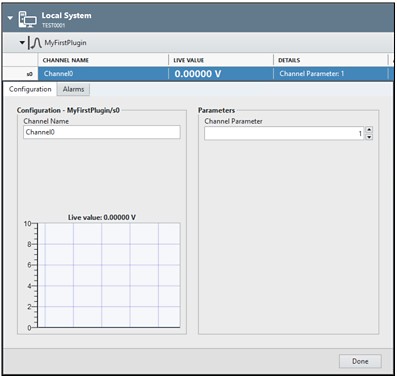
After the plug-in is deployed, you can add, configure, and delete plug-ins from the Channel Specifications tab in the FlexLogger software. It automatically generates the dialog-box user interface to configure plug-in and channel parameters defined in your code. For plug-ins that generate data and send it to the FlexLogger environment, the dialog also provides a live value graph to visualize the channel waveforms.
Figure 2: Plug-In Configuration
How Do Plug-Ins Work?
The architecture of a plug-in uses a state model to interact with FlexLogger software. The plug-in state model consists of five states: Initialize, Configure Session, Process, Cleanup Session, and Finalize. The FlexLogger data engine manages the transitions between these states.
Figure 3: Plug-In State Model
| State | Function |
|---|---|
| Initialize | Runs once when the plug-in is added to the channel specification. Defines plug-in parameters, channels, and channel parameters. |
| Configure Session | Reads plug-in and channel parameters set in FlexLogger software to configure hardware sessions. |
| Process | Continuously acquires from third-party hardware to write channel data to FlexLogger software or reads channel setpoint data from FlexLogger software to control third-party hardware. |
| Cleanup Session | Cleans up hardware sessions and resources initialized during the Configure Session state. |
| Finalize | Runs when plug-in is being shut down, either during FlexLogger software project close or when the plug-in is removed. Cleans up resources initialized during the Initialize state. |
Tools for Developing and Distributing Plug-Ins
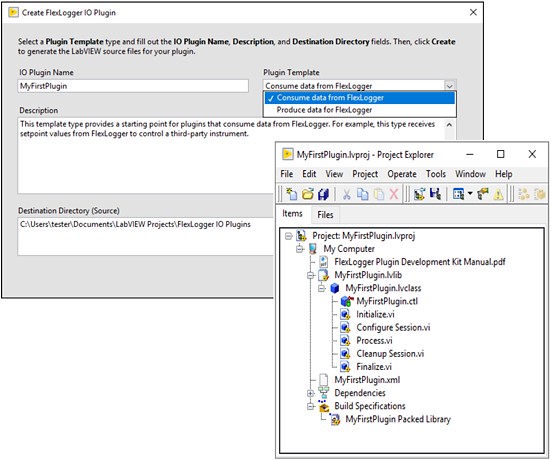
The PDK includes a LabVIEW project template and wizard that provide a high-level starting point for plug-in developers to get started quickly. It creates a new LabVIEW project with necessary source files; dependencies; a new LabVIEW class; a corresponding XML file; and a Packed Library build specification.
Figure 4: Accelerate plug-in development with PDK Project templates.
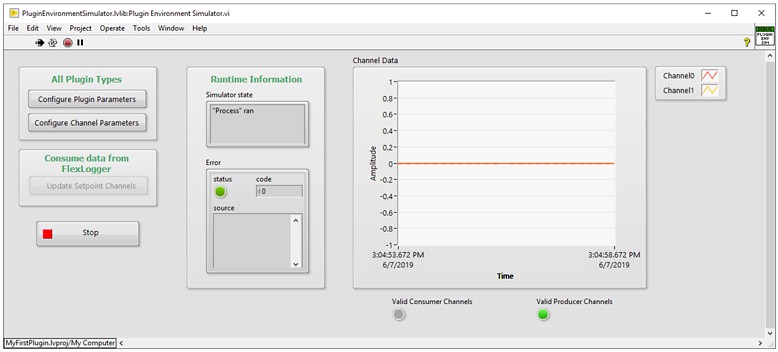
By combining the PDK with hundreds of LabVIEW Plug and Play instrument drivers and well-documented examples, you can see how to map functionality from a functional stand-alone LabVIEW VI to the FlexLogger software plug-in class. The PDK also installs a FlexLogger software palette in LabVIEW and a Plugin Environment Simulator to simplify development and debugging.
Figure 5: Simplify debugging with the PDK Plugin Environment Simulator.
Communicating with External Systems and Applications
You can use SystemLink software tags to communicate with external applications using LabVIEW, HTTP, and Python APIs, available through SystemLink software. With FlexLogger software, you can turn on tag publishing, including logging state and channel data, and characteristics such as min, max, and mean. You could access these tags, for example, from a stand-alone LabVIEW executable or Python script, which you would then use to commence logging in FlexLogger software at the start of an environmental chamber cycle.
Figure 6: Enable FlexLogger software tag publishing to communicate with external applications.
Remote Visualization
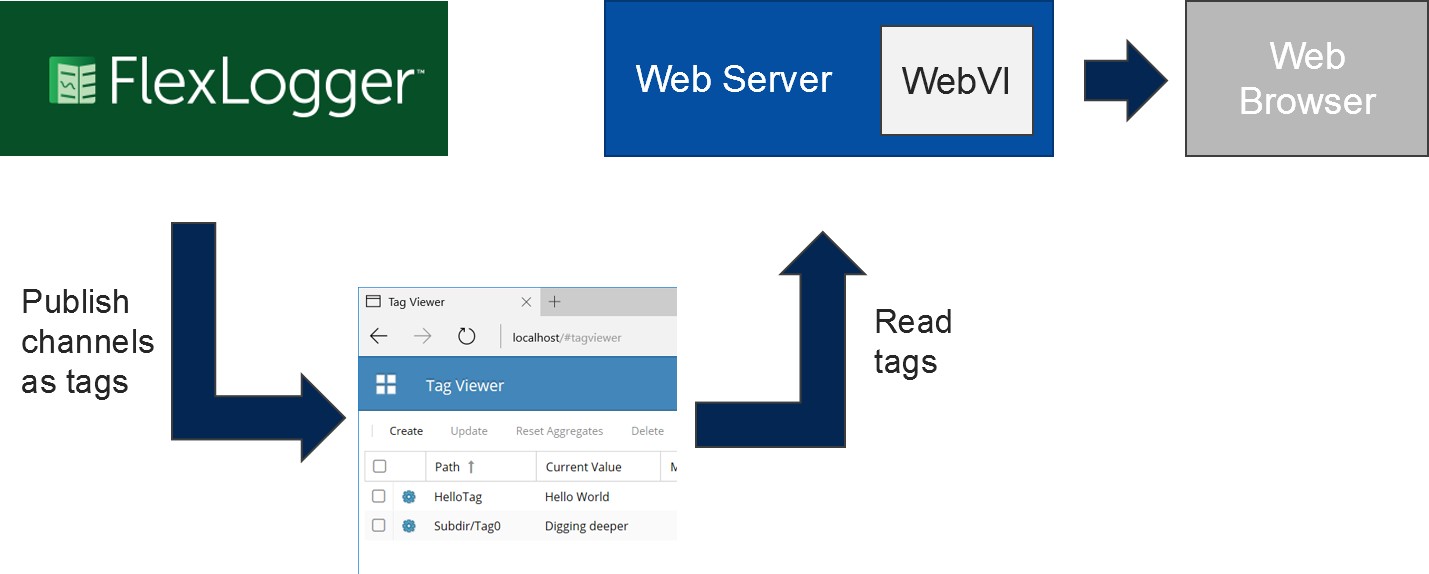
Long duration tests or harsh environmental conditions may limit your ability to monitor data from the test location. You can combine FlexLogger software’s built-in tag publishing with the remote visualization capabilities of the G Web Development Software to visualize your data anywhere within the same network. You can use the module to build and deploy a WebVI to a local web server that reads the SystemLink software tags published by FlexLogger software.
Figure 7: Deploy a local web server to read FlexLogger tags from anywhere within the same network.
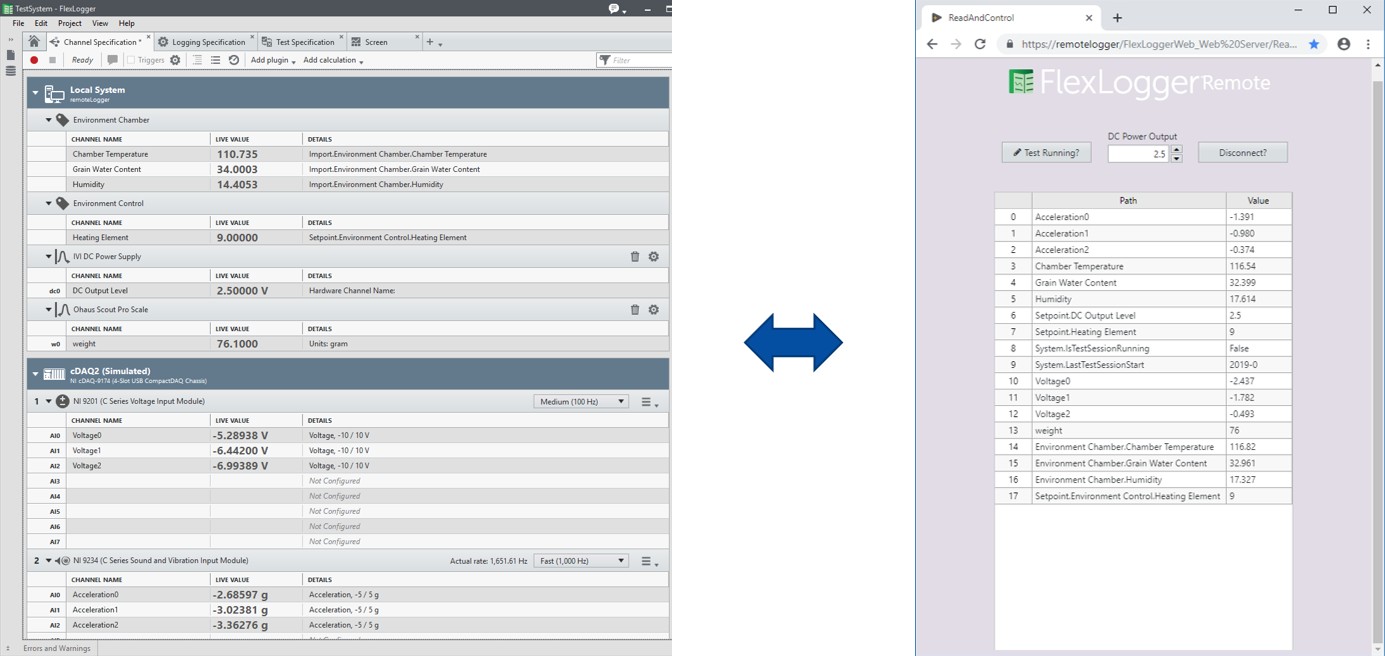
The G Web Development Software provides drag-and-drop engineering widgets to design and deploy web-based user interfaces built on standard web technologies (HTML, CSS, and JavaScript). The module simplifies hosting and sharing your web application because you can run your customized user interface in any modern web browser, tablet, or phone without additional plug-ins or installers.
Figure 8: Deploy WebVIs to visualize FlexLogger data remotely.
