Image Processing with NI Vision Development Module
Overview
Contents
Image Analysis
Image analysis combines techniques that compute statistics and measurements based on the gray-level intensities of the image pixels. You can use the image analysis functions to determine whether the image quality is good enough for your inspection task. You can also analyze an image to understand its content and to decide which type of inspection tools to use to handle your application. Image analysis functions also provide measurements you can use to perform basic inspection tasks such as presence or absence verification.
Common tools you can use for image analysis include histograms and line profile measurements.
Histogram
A histogram counts and graphs the total number of pixels at each grayscale level. Use the histogram to determine if the overall intensity in the image is suitable for your inspection task. Based on the histogram data, you can adjust your image acquisition conditions to acquire higher quality images.
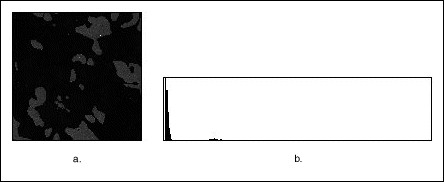
You can detect whether a sensor is underexposed or saturated by looking at the histogram. An underexposed image contains a large number of pixels with low gray-level values, as shown in Figure 1a. The low gray-level values appear as a peak at the lower end of the histogram, as shown in Figure 1b.
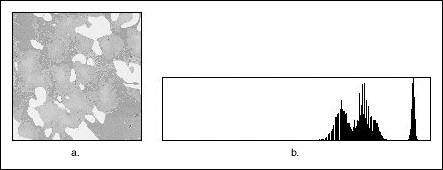
An overexposed, or saturated image, contains a large number of pixels with very high gray-level values, as shown in Figure 2a. This condition is represented by a peak at the upper end of the histogram, as shown in Figure 2b.
Figure 1: An Underexposed Image and Histogram
Figure 2: An Overexposed Image and Histogram
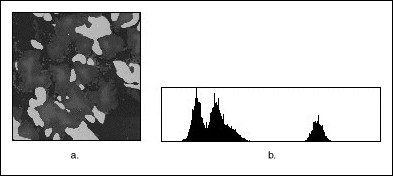
Lack of contrast: A strategy to separate the objects from the background relies on a difference in the intensities of both, for example, bright particles and a darker background. The analysis of the histogram in Figure 3b reveals that Figure 3a has two or more well-separated intensity populations. Adjust your imaging setup until the histogram of your acquired images has the contrast required by your application.
Figure 3: A Grayscale Image and Histogram
Line Profile
A line profile plots the variations of intensity along a line. It returns the grayscale values of the pixels along a line and graphs it. Line profiles are helpful for examining boundaries between components, quantifying the magnitude of intensity variations, and detecting the presence of repetitive patterns.
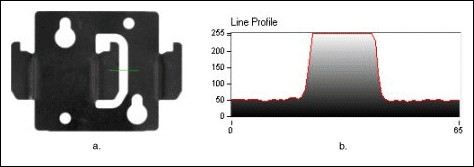
Figure 4 shows how a bright object with uniform intensity appears in the profile as a plateau. The higher the contrast between an object and its surrounding background, the steeper the slopes of the plateau. Noisy pixels, on the other hand, produce a series of narrow peaks.
Figure 4: A Line and Corresponding Line Profile
Image Processing
Using the information you gathered from analyzing your image, you may want to improve the quality of your image for inspection. You can improve the image by removing noise, highlighting features in which you are interested, and separating the object of interest from the background. Tools you can use to improve your image include:
- Lookup Tables
- Spatial Filters
- Grayscale Morphology
- Frequency-Domain
Lookup Tables
A lookup table (LUT) transformation converts grayscale values in the source image into other grayscale values in the transformed image. Use LUT transformations to improve the contrast and brightness of an image by modifying the dynamic intensity of regions with poor contrast.
Spatial Filters
Spatial filters improve the image quality by removing noise and smoothing, sharpening, and transforming the image. Vision Development Module comes with many already-defined filters, such as:
- Gaussian filters (for smoothing images)
- Laplacian filters (for highlighting image details)
- Median and Nth Order filters (for noise removal)
- Prewitt, Roberts, and Sobel filters (for edge detection)
- Custom filter
You can also define your own custom filter by specifying your own filter coefficients.
Grayscale Morphology
Morphological transformations extract and alter the structure of particles in an image. You can use grayscale morphology functions to do the following:
- Filter or smooth the pixel intensities of an image
- Alter the shape of regions by expanding bright areas at the expense of dark areas and vice versa
- Remove or enhance isolated features, such as bright pixels on a dark background
- Smooth gradually varying patterns and increase the contrast in boundary areas
Frequency-Domain Processing
Most image processing is performed in the spatial domain. However, you may want to process an image in the frequency domain to remove unwanted frequency information before you analyze and process the image as you normally would. Use a fast Fourier transform (FFT) to convert an image into its frequency domain.
Blob Analysis
A blob (binary large object) is an area of touching pixels with the same logical state. All pixels in an image that belong to a blob are in a foreground state. All other pixels are in a background state. In a binary image, pixels in the background have values=0 while every nonzero pixel is part of a binary object.
You can use blob analysis to detect blobs in an image and make selected measurements of those blobs.
Use blob analysis to find statistical information-such as the size of blobs or the number, location, and presence of blob regions. With this information, you can perform many machine vision inspection tasks, such as detecting flaws on silicon wafers, detecting soldering defects on electronic boards, or Web inspection applications such as finding structural defects on wood planks or detecting cracks on plastics sheets. You can also locate objects in motion control applications when there is significant variance in part shape or orientation.
In applications where there is a significant variance in the shape or orientation of an object, blob analysis is a powerful and flexible way to search for the object. You can use a combination of the measurements obtained through blob analysis to define a feature set that uniquely defines the shape of the object.
Thresholding
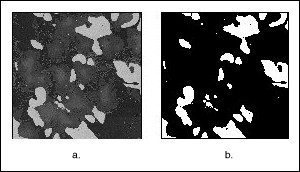
Thresholding enables you to select ranges of pixel values in grayscale and color images that separate the objects under consideration from the background. Thresholding converts an image into a binary image, with pixel values of 0 or 1. This process works by setting to 1 all pixels whose value falls within a certain range, called the threshold interval, and setting all other pixel values in the image to 0. Figure 5a shows a grayscale image, and 5b shows the same image after thresholding.
Figure 5: An Image Before and After Thresholding
Binary Morphology
Binary morphological operations extract and alter the structure of particles in a binary image. You can use these operations during your inspection application to improve the information in a binary image before making particle measurements, such as the area, perimeter, and orientation. You can also use these transformations to observe the geometry of regions and to extract the simplest forms for modeling and identification purposes.
Primary Binary Morphology
Primary morphological operations work on binary images to process each pixel based on its neighborhood. Each pixel is set either to 1 or 0, depending on its neighborhood information and the operation used. These operations always change the overall size and shape of the particles in the image.
Use the primary morphological operations for expanding or reducing particles, smoothing the borders of objects, finding the external and internal boundaries of particles, and locating particular configurations of pixels.
Advanced Binary Morphology
Use the advanced morphological operations for filling holes in particles, removing particles that touch the border of the image, remove unwanted small and large particles, separate touching particles, finding the convex hull of particles, and more.
Particle Measurements
After you create a binary image and improve it, you can make up to 50 particle measurements. With these measurements you can determine the location of blobs and their shape features. You can use these features to classify or filter the particles based on one or many measurements. For example, you can filter out particles whose areas are less than x pixels.
Machine Vision
The most common machine vision inspection tasks are detecting the presence or absence of parts in an image and measuring the dimensions of parts to see if they meet specifications. Measurements are based on characteristic features of the object represented in the image. Image processing algorithms traditionally classify the type of information contained in an image as edges, surfaces and textures, or patterns. Different types of machine vision algorithms leverage and extract one or more types of information.
Edge Detection
Edge detectors and derivative techniques, such as rakes, concentric rakes, and spokes, locate the edges of an object with high accuracy. An edge is a significant change in the grayscale values between adjacent pixels in an image. You can use the location of the edge to make measurements, such as the width of the part. You can use multiple edge locations to compute such measurements as intersection points, projections, and circle or ellipse fits.
Edge detection is an effective tool for many machine vision applications. Edge detection provides your application with information about the location of the boundaries of objects and the presence of discontinuities. Use edge detection in the following three applications areas – gauging, detection, and alignment.
Gauging
Use gauging to make critical dimensional measurements such as lengths, distances, diameters, angles, and counts to determine if the product under inspection is manufactured correctly. The component or part is either classified or rejected, depending on whether the gauged parameters fall inside or outside of the user-defined tolerance limits.
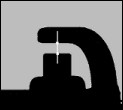
Figure 6 shows how a gauging application uses edge detection to measure the length of the gap in a spark plug.
Figure 6: Using Edge Detection to Measure the Gap Between Spark Plug Electrodes
Detection
The objective of detection applications is to determine if a part is present or absent using line profiles and edge detection. An edge along the line profile is defined by the level of contrast between background and foreground and the slope of the transition. Using this technique, you can count the number of edges along the line profile and compare the result to an expected number of edges. This method offers a less numerically intensive alternative to other image processing methods such as image correlation and pattern matching.
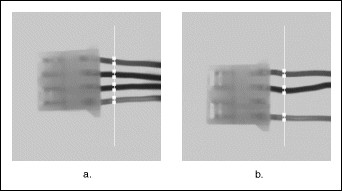
Figure 7 shows a simple detection application in which the number of edges detected along the search line profile determines if a connector has been assembled properly. The detection of eight edges indicates that there are four wires and the connector passes inspection, as shown in Figure 7a. Any other edge count indicates that the connector was not assembled correctly, as shown in Figure 7b.
Figure 7: Using Edge Detection to Detect the Presence of a Part
You can also use edge detection to detect structural defects, such as cracks, or cosmetic defects, such as scratches on a part. If the part is of uniform intensity, these defects show up as sharp changes in the intensity profile. Edge detection identifies these changes.
Alignment
Alignment determines the position and orientation of a part. In many machine vision applications, the object that you want to inspect may be at different locations in the image. Edge detection finds the location of the object in the image before you perform the inspection, so that you can inspect only the regions of interest. The position and orientation of the part can also be used to provide feedback information to a positioning device, such as a stage.
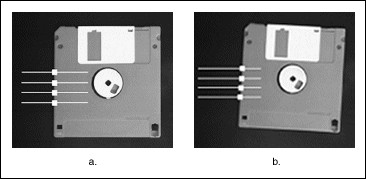
Figure 8 shows an application that detects the left edge of a disk in the image. You can use the location of the edges to determine the orientation of the disk. Then you can use the orientation information to position the regions of inspection properly.
Figure 8: Using Edge Detection to Position a Region of Inspection
Pattern Matching
Pattern matching locates regions of a grayscale image that match a predetermined template. Pattern matching finds template matches regardless of poor lighting, blur, noise, shifting of the template, or rotation of the template.
Use pattern matching to quickly locate known reference patterns, or fiducials, in an image. With pattern matching you create a model or template that represents the object for which you are searching. Then your machine vision application searches for the model in each acquired image, calculating a score for each match. The score relates how closely the model matches the pattern found.
Pattern matching algorithms are some of the most important functions in image processing because of their use in varying applications. You can use pattern matching in the following three general applications – alignment, gauging, and inspection.
Dimensional Measurements
You can use dimensional measurement, or gauging tools, in the Vision Development Module to obtain quantifiable, critical distance measurements. Typical measurements include:
- Distance between points
- Angle between two lines represented by three or four points
- Best line, circular, or elliptical fits;
- Areas of geometric shapes-such as circles, ellipses, and polygons
Color Inspection
Color can simplify a monochrome visual inspection problem by improving contrast or separating the object from the background. Color inspection involves three areas:
- Color matching
- Color location
- Color pattern matching
Color Matching
Color matching quantifies which colors and how much of each color exist in a region of an image and uses this information to check if another image contains the same colors in the same ratio.
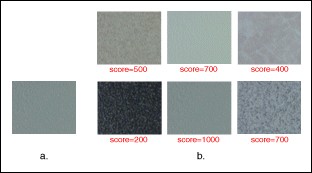
Use color matching to compare the color content of an image or regions within an image to reference color information. With color matching you create an image or select regions in an image that contain the color information you want to use as a reference. The color information in the image may consist of one or more colors. The machine vision software then learns the 3D color information in the image and represents it as a 1D color spectrum. Your machine vision application compares the color information in the entire image or regions in the image to the learned color spectrum, calculating a score for each region. The score relates how closely the color information in the region matches the information represented by the color spectrum.
Figure 9 shows an example of a tile identification application. Figure 9a shows a tile that needs to be identified. Figure 9b shows a set of reference tiles and their color matching scores obtained during color matching.
Figure 9: Using Color Matching to Identify Tiles
Color Location
Use color location to quickly locate known color regions in an image. With color location, you create a model or template that represents the colors that you are searching. Your machine vision application then searches for the model in each acquired image and calculates a score for each match. The score indicates how closely the color information in the model matches the color information in the regions found.
Color location algorithms provide a quick way to locate regions in an image with specific colors. Use color location when your application:
- Requires the location and the number of regions in an image with their specific color information
- Relies on the cumulative color information in the region, instead of how the colors are arranged in the region
- Does not require the orientation of the region
- Does not require the location with subpixel accuracy
Use color location in inspection, identification, and sorting applications.
Figure 10 shows a candy sorting application. Using color templates of the different candies in the image, color location quickly locates the positions of the different candies.
Figure 10: Using Color Location to Sort Candy
Color Pattern Matching
Use color pattern matching to quickly locate known reference patterns, or fiducials, in a color image. With color pattern matching, you create a model or template that represents the object for which you are searching. Then your machine vision application searches for the model in each acquired image, calculating a score for each match. The score indicates how closely the model matches the color pattern found. Use color pattern matching to locate reference patterns that are fully described by the color and spatial information in the pattern.
Use color pattern matching if:
- The object you want to locate contains color information that is very different from the background, and you want to find the location of the object in the image very precisely. For these applications, color pattern matching provides a more accurate solution than color location because it uses shape information during the search phase.
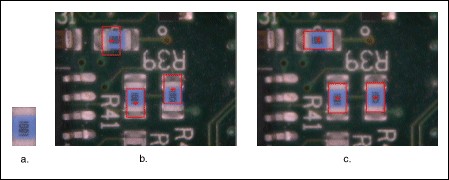
Figure 11 shows the difference between color location and color pattern matching. Figure 11a is the template image of a resistor that the algorithms are searching for in the inspection images. Although color location, shown in Figure 11b, finds the resistors, the matches are not very accurate because they are limited to color information. Color pattern matching uses color matching first to locate the objects and then uses pattern matching to refine the locations, providing more accurate results, as shown in Figure 11c.
Figure 11: Using Color Pattern Matching to Accurately Locate Resistors
Additional Resources
- Vision Development Module Image Processing Examples
- What's New in the NI Vision Development Module
- Download the latest version of Vision Development Module
- NI Vision Hardware and Software Overview
