UFSC Uses LabVIEW and NI CompactDAQ for Acoustic Beamforming in Vehicle Pass-By Noise Tests
William D’Andrea Fonseca, Federal University of Santa Catarina (UFSC)

"We chose NI hardware because it is compact and DC-powered, and provides power to the microphones used in the array."
- William D’Andrea Fonseca, Federal University of Santa Catarina (UFSC)
The Challenge:
Developing a portable and affordable acoustic beamformer for noise source identification in pass-by noise measurements and other applications.
The Solution:
Using a spiral array of 32 microphones, NI LabVIEW software, the NI Sound and Vibration Measurement Suite, and a 32-channel NI CompactDAQ system with eight NI 9234 4-channel dynamic signal acquisition (DSA) modules to acquire visual images of noise sources to aid in identifying the signals from moving vehicles.
Author(s):
William D’Andrea Fonseca - Federal University of Santa Catarina (UFSC)
Samir N. Y. Gerges - Federal University of Santa Catarina (UFSC)
The Laboratory of Noise and Vibration at the Federal University of Santa Catarina (UFSC) in Brazil is involved in various projects including R&D assistance to the automobile industry to adapt its products to noise and vibration standards. In addition to helping local industries, this supports academic developments in teaching and research for undergraduate and postgraduate students.
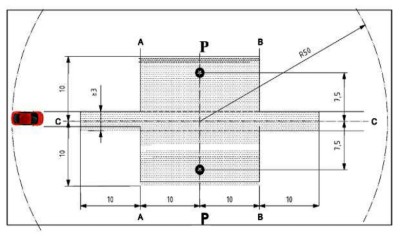
Pass-by noise tests are standardized to quantify the maximum sideline noise level during vehicle operation. The test is regulated in most countries with specific sound limits defined by relevant government agencies, typically ISO 362 – measurement of noise emitted by accelerating road vehicles. The specifications are intended to reproduce the level of noise generated by the principal noise sources during normal driving in urban traffic, typically on roads with speed limits of 50 km/h and 70 km/h. The vehicle pass-by noise test certifies that a car complies with the standard so its contribution to traffic noise is not above the permitted limit.
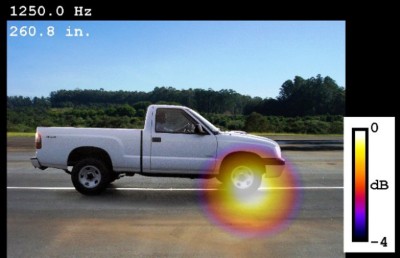
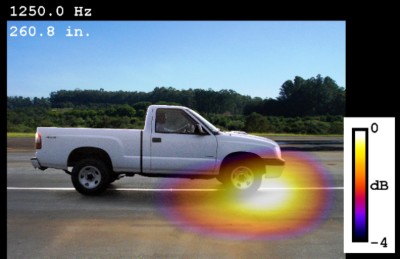
Many elements contribute to the total noise of a vehicle, such as the motor, exhaust, transmission, and tires. Because standard pass-by noise tests do not have the capacity to identify the sources emitting noise that leads to test failure, we needed technique a to visualize the acoustic field to identify these sources. By applying beamforming in this test, we can see which of these sources significantly contributes to the overall noise emission and has an impact on the vehicle’s pass-by noise.
Beamforming
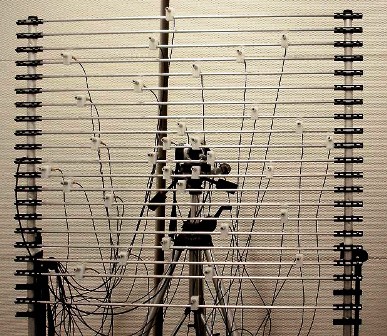
We composed the beamformer, or “acoustic camera,” to capture the visual image of noise sources using an array of 32 microphones arranged in a spiral with a maximum diameter of 1 m between the microphones and organized on a metal grid of 1.1 by 1 m. To provide the same conditions in all measurements imposed by the standardized pass-by test, the array positioning was the same as the single microphone position in the standardized test, 7.5 m from the central line of the pass path with the center 1.3 m from the ground.
Students built the array microphones based on low-cost electret cartridge microphones. Traditional directional array hardware, consisting of commercially available condenser microphones and preamplifiers, were too expensive for the laboratory. Building the complete array microphones saved money and provided a valuable project for students. We based the design on research by the NASA Langley Research Center, which concluded that the chosen electret cartridge offered a microphone frequency response suitable for directional array use with minimal magnitude and phase response variations in the audio frequency spectrum and moderate variations at higher frequencies.
Data Acquisition
We acquired data with eight NI 9234 DSA modules in an NI USB-9162 high-speed C Series USB carrier. We chose NI hardware because it is compact and DC-powered, and provides power to the microphones used in the array. The modules delivered an alias-free bandwidth up to 20 kHz. Also, phase matching of the channels is important in acoustic beamforming, and the system was specified to offer no more than one degree of phase mismatch between any two channels.
Because the system is DC-powered, it was easy to operate using batteries in the field. A laptop running LabVIEW software with the Sound and Vibration Measurement Suite made it easy to scale voltage to engineering units used in noise measurements. Additionally, the Sound and Vibration Measurement Suite is compliant with international standards for sound-level measurements, weighting filters, octave analysis according to IEC 61260 (electroacoustics, octave-band, and fractional-octave-band filters), and IEC 61672 (electroacoustics and sound level meters), making the measurements accurate and repeatable.
Analysis
After collecting the date data, we analyzed it with traditional delay-and-sum beamforming algorithms. We summarized the sound signals and accounted for the different propagation paths from the source and to the different microphones. The sources may pass the acoustic camera with high speeds (modern vehicles are still slow in comparison with the sampling speed of the data acquisition system), allowing the beam to focus and follow the bypassing source past the microphone array. To coherently sum the signals, we have to correct the Doppler Effect through the dedopplerization process, which involves amplitude and frequency correction.
To calibrate the acoustic measurement data and the photos of the vehicles being tested to overlay the amplitude of the noise, we turned on a buzzer (the main component around 90 dB at 2.2 kHz) and the vehicle, which maintained a constant speed of 50 kmh, passed by the array as it would in a regular pass-by test.
We implemented this procedure instead of a stationary measurement because it produced excellent results faster. It also represents the same kind of recording performed in pass-by measurements. The positioning of the buzzer allows correct alignment of the photos and data collected.
By applying this technique to moving vehicles, we provided an excellent assessment and identification of noise sources generated by the effects of movement, such as tires and turbulence around the vehicle body. This offered an excellent tool in taking steps to reduce vehicle pass-by noise outside of a wind tunnel.
Author Information:
William D’Andrea Fonseca
Federal University of Santa Catarina (UFSC)
Brazil
willdfonseca@yahoo.com.br
Products in this Case Study


