LabVIEW Debugging Techniques
Contents
NI LabVIEW software contains powerful debugging tools that help you zero in on problem code areas and make the appropriate changes. You may encounter two general types of software bugs in LabVIEW: those that prevent the program from running and those that generate bad results or incorrect behavior. Understanding LabVIEW’s debugging techniques is essential to ensure that your code is executing as expected and gathering useful data.
If LabVIEW cannot run your VI it informs you by changing the run arrow to a broken icon and the Error list window lists the specific reasons why the VI is broken. The second type of bug is typically harder to track down but LabVIEW has a number of tools that let you watch your code as it executes which makes the process much easier.
Fixing Broken VIs
If a VI does not run, it is a broken, or nonexecutable, VI. The Run button appears broken when the VI you are creating or editing contains errors..

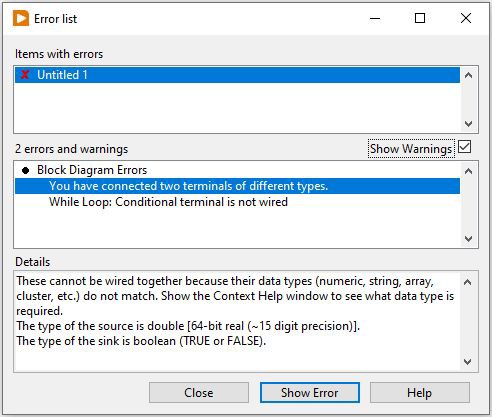
Generally, this means that a required input is not wired, or a wire is broken. Press the broken Run button to access the Error list window. The Error list window lists each error and describes the problem. You can double-click an error to go directly to the error.
Warnings do not prevent you from running a VI. They are designed to help you avoid potential problems in VIs. Errors, however, can break a VI. You must resolve any errors before you can run the VI.
Finding Causes for Broken VIs
Click the broken Run button or select View>>Error to find out why a VI is broken. The Error list window lists all the errors. The Items with errors section lists the names of all items in memory, such as VIs and project libraries that have errors. If two or more items have the same name, this section shows the specific application instance for each item. The errors and warnings section lists the errors and warnings for the VI you select in the Items with errors section. The Details section describes the errors and in some cases recommends how to correct the errors. Click the Help button to display a topic in the LabVIEW Help that describes the error in detail and includes step-by-step instructions for correcting the error.
Click the Show Error button or double-click the error description to highlight the area on the block diagram or front panel that contains the error.
Figure 1: The Error list dialog box lists each error and describes the problem.
Common Causes of Broken VIs
The following list contains common reasons why a VI is broken while you edit it:
- The block diagram contains a broken wire because of a mismatch of data types or a loose, unconnected end. Refer to the Correcting Broken VIs topic of the LabVIEW Help for information about correcting broken wires.
- A required block diagram terminal is unwired. Refer to the Using Wires to Link Block Diagram Objects topic of the LabVIEW Help for information about setting required inputs and outputs.
- A subVI is broken or you edited its connector pane after you placed its icon on the block diagram of the VI.
Fixing Incorrect Behavior
If your VI runs but produces incorrect results then you have a functional error in your code. LabVIEW provides several tools to help you analyze where your VI is not behaving as expected.
Block Diagram Toolbar
When you run a VI, buttons appear on the block diagram toolbar that you can use to debug the VI. The following toolbar appears on the block diagram.
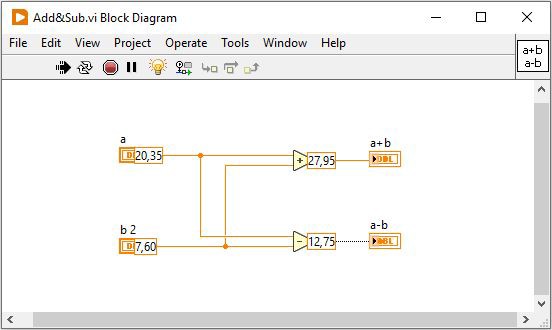
Click the Highlight Execution button to display an animation of the block diagram execution when you run the VI. Notice the flow of data through the block diagram. Click the button again to disable execution highlighting.

Execution highlighting shows the movement of data on the block diagram from one node to another using bubbles that move along the wires. Use execution highlighting in conjunction with single-stepping to see how data values move from node to node through a VI.
Note: Execution highlighting greatly reduces the speed at which the VI runs.
Figure 2: Execution highlighting shows the movement of data.
You can pause the execution of a VI at any time by choosing the pause button on the toolbar.

The color of the button turns to red when the VI is paused. Once you pause the VI, you can use the tools below to gain additional insight into the execution of your application.
Click the Retain Wire Values button to save the wire values at each point in the flow of execution so that when you place a probe on the wire you can immediately retain the most recent value of the data that passed through the wire.

You must successfully run the VI at least once before you can retain the wire values.
Click the Step Into button to open a node and pause.

When you click the Step Into button again, it executes the first action and pauses at the next action of the subVI or structure. You also can press the ctrl and down arrow keys. Single-stepping through a VI steps through the VI node by node. Each node blinks to denote when it is ready to execute.
Click the Step Over button to execute a node and pause at the next node.

You also can press the ctrl and right arrow keys. By stepping over the node, you execute the node without single-stepping through the node.
Click the Step Out button to finish executing the current node and pause.

When the VI finishes executing, the Step Out button is dimmed. You also can press the ctrl and up arrow keys. By stepping out of a node, you complete single-stepping through the node and navigate to the next node.
The Warning button appears if a VI includes a warning and you placed a checkmark in the Show Warnings checkbox in the Error list window.

A warning indicates there is a potential problem with the block diagram, but it does not stop the VI from running.
Probe Watch Window
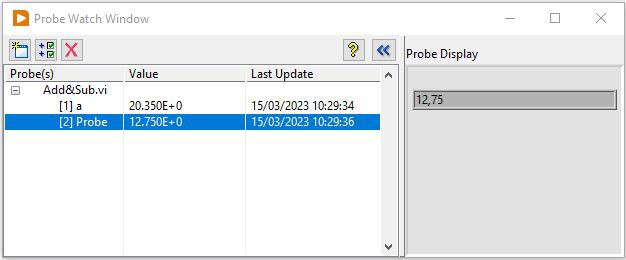
Use the Probe tool (View>>Probe Watch Window) to check intermediate values on a wire as a VI runs. Move your cursor over a wire while the VI is running or right-click on the wire and choose Probe to generate a probe. Use the Probe tool if you have a complicated block diagram with a series of operations, any one of which might return incorrect data. Use the Probe tool with execution highlighting, single-stepping, and breakpoints to determine if and where data is incorrect. If data is available, the probe immediately updates and displays the data in the Probe Watch Window during execution highlighting, single-stepping, or when you pause at a breakpoint.
Figure 3: The Probe Watch Window displays any and all probes active in your project.
When execution pauses at a node because of single-stepping or a breakpoint, you also can probe the wire that just executed to see the value that flowed through that wire.
Breakpoint Manager
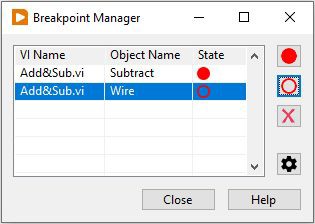
You can use the Breakpoint Manager (View>>Breakpoint Manager) to view, add, or delete breakpoints from your code. A breakpoint will pause the execution of the VI when that specific object is executed. You can place a VI, structure, wire, or operator.
Figure 4: You can use the Breakpoint Manager to add, delete, or view breakpoints in your code.
Debugging LabVIEW Code
The ability to not only write efficient code, but help you debug nonworking code is a critical component of any tool. The LabVIEW development environment contains an array of tools at your disposal to both find and fix problem areas in your code.


