LabVIEW Block Diagram Explained
Overview
The block diagram contains the graphical source code of a LabVIEW program. The concept of the block diagram is to separate the graphical source code from the user interface in a logical and simple manner. Front panel objects appear as terminals on the block diagram. Terminals on the block diagram reflect the changes made to their corresponding front panel objects and vice versa.
Block Diagram Window
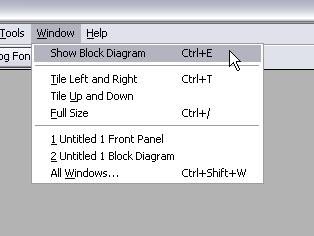
When you create or open a new VI, the front panel opens automatically. To bring up the block diagram, select Window»Show Block Diagram from the menu bar. Additionally, you can toggle between the block diagram and the front panel by pressing <Ctrl+E>.
Block Diagram Objects and Environment
Block diagram objects include terminals, subVIs, functions, constants, structures, and wires that transfer data among other block diagram objects. You can use LabVIEW tools to create, modify, and debug a VI. A tool is a special operating mode of the mouse cursor, so the operating mode of the cursor corresponds to the icon of the tool selected. LabVIEW chooses which tool to select based on the current location of the mouse. You can manually choose the tool you need by selecting it on the Tools palette (from the menu bar, select View»Tools Palette). Now you can choose your desired tool, which remains selected until you choose another tool from the Tools palette.
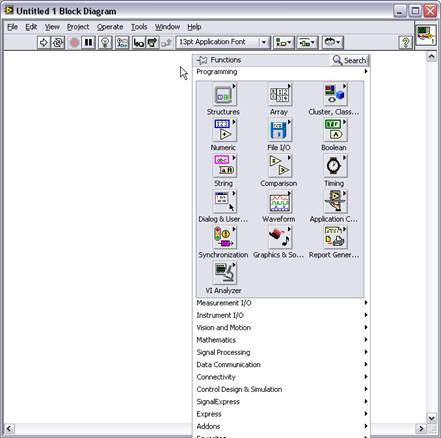
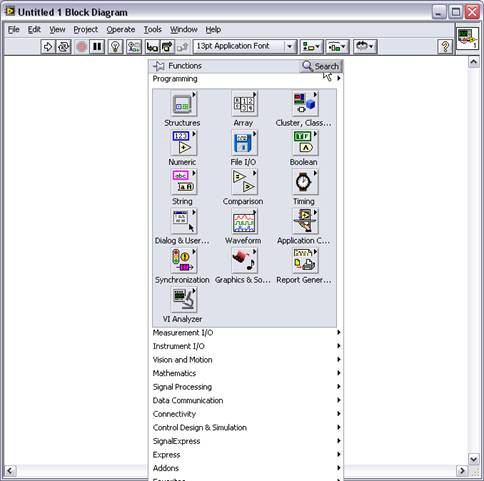
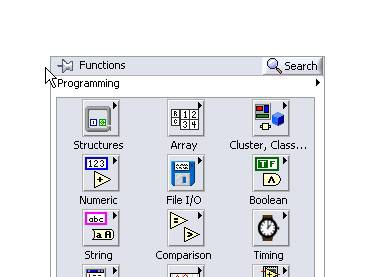
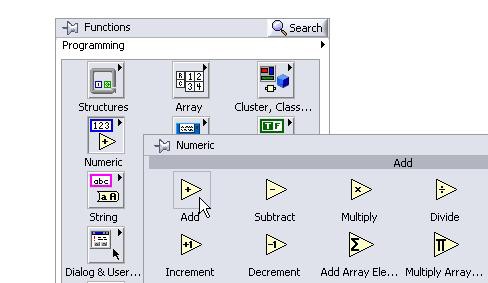
To place objects on the block diagram, simply drag and drop them from the Functions palette. The Functions palette automatically appears when you right-click anywhere on the block diagram workspace. It contains functions, constants, structures, and some subVIs.
Notice the two buttons on the top of the Functions palette.
The Thumb Tack pins the Functions palette to the block diagram.
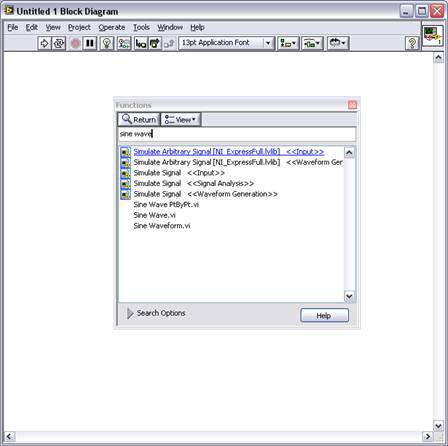
The Search button opens a search dialog box that you can use to search for functions by name.
Click the Search button to launch the functions search engine. It takes a few moments to launch.
You can use this tool to search for a function by name if you are having trouble finding it.
Once you see the function you want, double -click on it and LabVIEW jumps to the place on the Functions palette where you can find that function.
Note: Complete the following steps to change the subpalettes visible on the Functions palette:
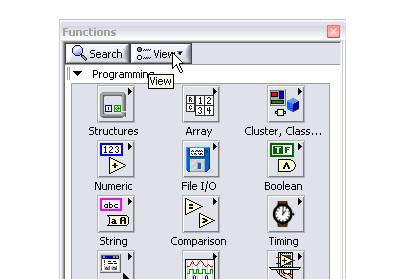
1. Use the thumb tack to pin the Functions palette to the block diagram.
2. Notice the View button appears when you pin the Functions palette to the block diagram.
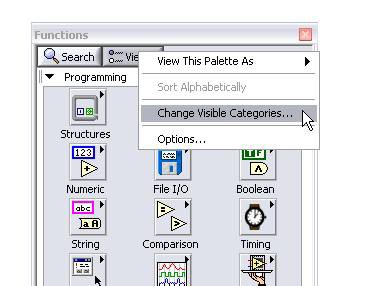
3. Select View and, from the shortcut menu, select Change Visible Categories.
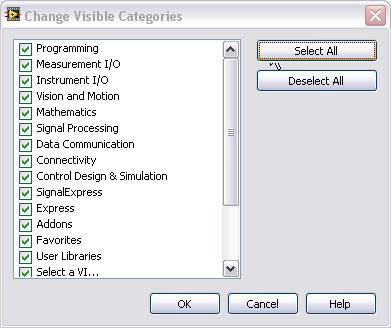
4. In the Change Visible Categories dialog box, you can select the Palettes that you use the most or click Select All to include all Palettes.
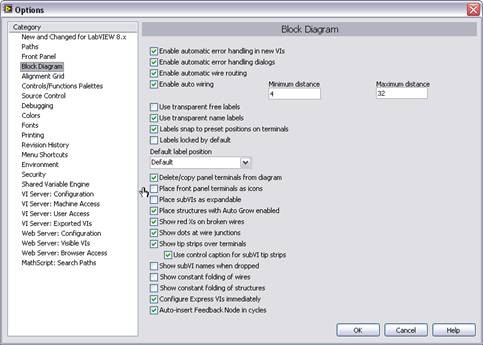
To change the appearance of the block diagram, select Tools»Options from the menu bar. In the Options dialog box, select the Block Diagram category. Here you can customize the appearance of your block diagram. To save space on the block diagram, deselect Place front panel terminals as icons.
Terminals
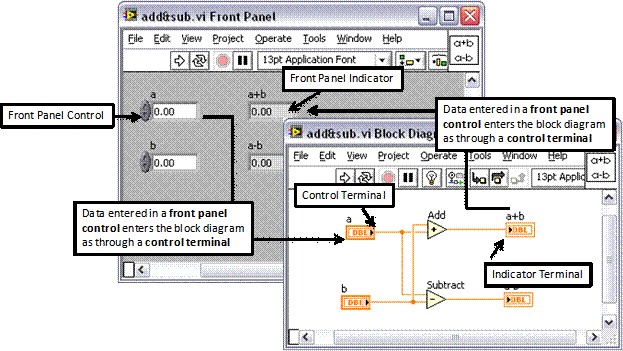
Terminals create the block diagram appearance of objects on the front panel. In addition, they are entry and exit ports that exchange information between the front panel and block diagram. Analogous to parameters and constants in text-based programming languages, terminals come in two types: control or indicator terminals and node terminals. Control and indicator terminals belong to front panel controls and indicators.
In the example above, data you enter in front panel controls a and b enter the block diagram through their respective control terminals a and b. The data then enter the Add and Subtract functions. When the Add and Subtract functions complete their calculations, they produce new data values. The data values flow to the indicator terminals, where they update the front panel indicators a+b and a-b.
Controls, Indicators, and Constants
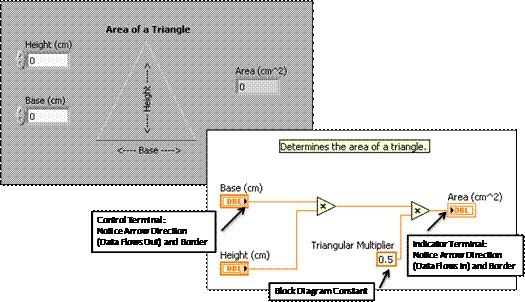
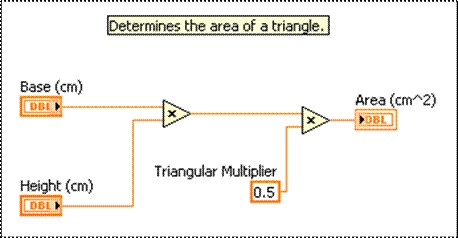
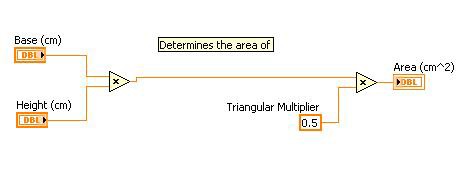
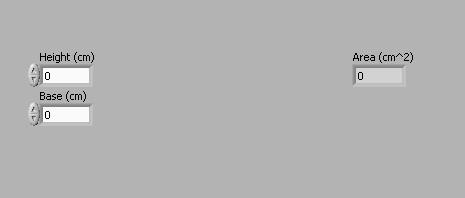
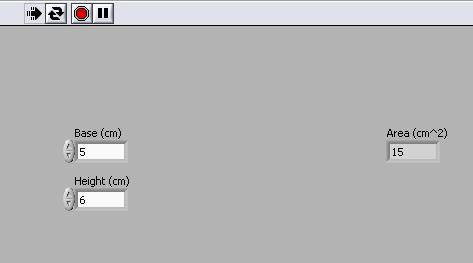
Controls, indicators, and constants operate as the inputs and outputs of the block diagram algorithm. Controls receive their values from the front panel and pass data to other block diagram objects. Indicators receive their values from block diagram logic and pass data from the block diagram to the front panel. Constants pass data to the object to which they are wired. Consider an algorithm for computing the area of a triangle. You might have the following front panel and corresponding block diagram.
The constant Triangular Multiplier does not necessarily appear on the front panel window except possibly as documentation of the algorithm. It simply passes the value of .5 into the multiply function. Notice that the Base(cm) and Height(cm) block diagram terminals look different from the Area(cm^2) terminal. There are two distinguishing characteristics between a control and an indicator on the block diagram. The first is an arrow on the terminal that indicates the direction of data flow. The controls have arrows showing the data leaving the terminal, whereas the indicator has an arrow showing the data entering the terminal. The second distinguishing characteristic is the border around the terminal. Controls have a thick border and indicators have a thin border.
You can create controls and indicators from either the block diagram or the front panel. This tutorial demonstrates this in a later section.
Block Diagram Nodes
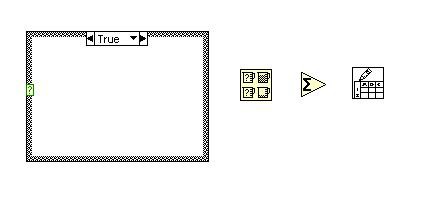
Nodes are objects on the block diagram that have inputs and/or outputs and perform operations when a VI runs. They are analogous to statements, operators, functions, and subroutines in text-based programming languages. Nodes can be functions, subVIs, or structures. Structures are process control elements, such as case structures, for loops, or while loops, which are covered in a later tutorial. The image below shows some examples of block diagram nodes.
Functions
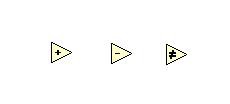
Functions are the fundamental operating elements of LabVIEW. Functions do not have front panel windows or block diagram windows, but they do have input and output terminals for passing data in and out similarly to controls and indicators. You can tell if a block diagram object is a function by the pale yellow background on its icon. The Functions palette has functions arranged in groups based on the type of function they perform. Look in the Numeric subpalette for functions that perform numeric operations.
There are many different types of functions. Remember that a function has a pale yellow background like the functions shown below.
SubVIs
SubVIs are VIs that you create to use inside another VI or that you access on the Functions palette. Any VI has the potential to be used as a subVI. When you double-click a subVI that is on the block diagram, its front panel window appears and you can access its block diagram. Some examples of the subVIs you can find in the Functions palette are shown below.
Structures
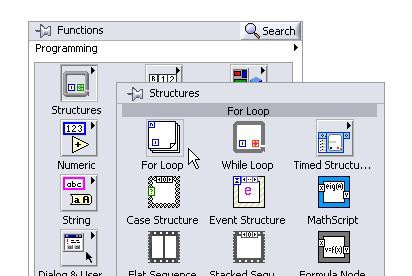
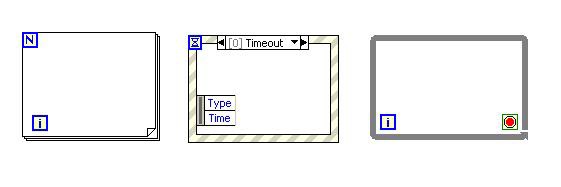
Structures, which include for loops, case structures, and while loops, are used for process control. They are examined in a later tutorial. You can open the Structures subpalette from the Functions palette under Programming.
Below are some examples of different structures and how they look on the block diagram.
Now create the block diagram shown below by following these steps:
1. Open a blank VI from the toolbar. Select File»New VI.
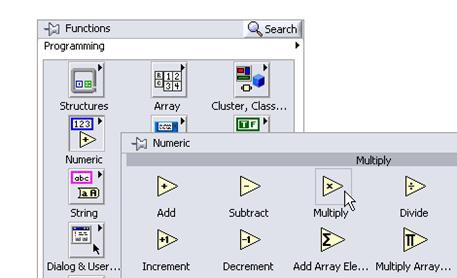
2. Put two multiply functions on the block diagram by dragging them onto the block diagram from the Numeric subpalette under Programming. Repeat to put a second multiply function on the block diagram.
Tip: To copy an object on the block diagram, hold down <Ctrl> while you click and drag the object.
3. Hover your mouse over the left-most multiply function to make the input and output terminals appear. If you hold your mouse over one of the terminals, the wire spool appears along with the name of the terminal you are hovering over.
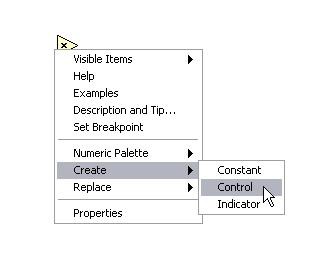
To create a control for the y terminal, simply hover your mouse over it and right-click.
Do the same for the x terminal on the left-most multiply function so that you have a control for each input terminal.
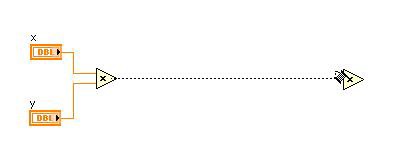
4. Wire the output terminal of the left multiply function to the x input of the right multiply function by hovering your mouse over the output terminal. When it turns into the wiring spool, click and hold while you drag the wire to the desired input.
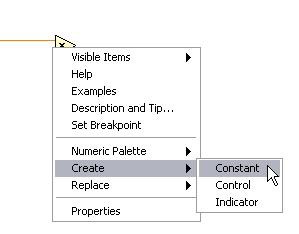
5. Create the Triangular Multiplier constant .5 by right-clicking on the y input terminal of the right-most multiply function and selecting Create»Constant. You can change the value of a constant by double-clicking it to highlight the text and typing in the new value. Type in .5 and press <Enter>.
6. Now right-click the output of the right multiply function and select Create»Indicator to create an indicator that passes the value of the block diagram logic to the front panel.
Tip: You can make comments on the block diagram or the front panel by double-clicking the block diagram and typing your comment into the automatically created text box.
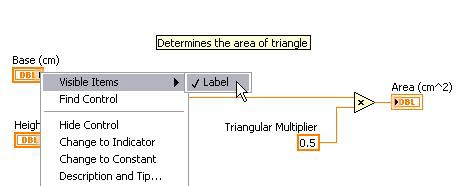
You can change the name of indicators, controls, and constants by double-clicking the label and typing in the desired name. If there is no label showing, right-click the desired object and select Visible Items»Label.
7. Now look at the front panel that was generated from your work on the block diagram by pressing <Ctrl+E> or selecting Window»Show Front Panel. Notice that the two controls Base(cm) and Height(cm) and the indicator Area(cm^2) were automatically generated and placed on the front panel. You will run this program after learning about the toolbar icons.
Block Diagram Window Toolbar
When you run a VI, the following toolbar appears on the block diagram. You can use some of the buttons on the block diagram toolbar to debug the VI. Those buttons are covered in a later tutorial.
Click the Run button to run your VI. You do not need to compile your code; LabVIEW compiles it automatically. You can run a VI if the Run button appears as a solid white arrow, shown at left.
The Run button appears broken when the VI you are creating or editing contains errors. If the Run button still appears broken after you finish wiring the block diagram, the VI is broken and cannot run. Click this button to display the Error List window, which lists all errors and warnings.
Click Run Continuously to run the VI until you abort or pause execution. You also can click the button again to disable continuous running.
While the VI runs, the Abort Execution button appears. Click this button to stop the VI immediately if there is no other way to stop the VI. If more than one running top-level VI uses the VI, the button is dimmed.
Caution: The Abort Execution button stops the VI immediately before it finishes the current iteration. Aborting a VI that uses external resources, such as external hardware, might leave the resources in an unknown state by not resetting or releasing them properly. Design VIs with a stop button to avoid this problem.
Click Pause to pause a running VI. When you click the Pause button, LabVIEW highlights on the block diagram the location where you paused execution, and the Pause button appears red. Click the Pause button again to continue running the VI.
Select the Text Settings pull-down menu to change the font settings for the selected portions of your VI, including size, style, and color.
Click the Align Objects pull-down menu to align objects along axes, including vertical, edge, and left.
Click the Distribute Objects pull-down menu to resize multiple front panel objects to the same size.
Click the Reorder pull-down menu when your objects overlap each other and you want to define which one is in front or back of another. Select one of the objects with the Positioning tool and then select from Move Forward, Move Backward, Move To Front, and Move To Back.
Click the Show Context Help Window button to toggle the display of the context help window.
Enter Text appears to remind you that a new value is available to replace an old value. The Enter Text button disappears when you click it, press the <Enter> key, or click the front panel or block diagram workspace.
Running a VI from the Block Diagram
Finally, click the Run Continuously button on the VI you just created and change the values on the front panel. Watch how changing the control values of a and b updates the indicator value of a*b.
Values put into the controls on the front are passed to the block diagram, and the result that is computed by the block diagram logic is passed back to the front panel indicator.
Click the Abort Execution button to stop the VI. Save and close the VI by selecting File»Save from the menu bar and then clicking the Close button in the top right corner of the front panel window.
The block diagram is the most fundamental aspect of any virtual instrument. It controls everything from data flow to passing data in and out of the front panel. It is essential for a LabVIEW programmer to have a clear and solid understanding of how the block diagram works.
