Signal Generator Terminology and Specifications
Overview
This tutorial includes descriptions of signal generator terminology and specifications.
Contents
- Bandwidth & Sample Rate
- Resolution
- Memory Depth
- Spurious Free Dynamic Range
- Total Harmonic Distortion
- Signal-to-Noise Ratio and Effective Number of Bits
- Phase Noise
- Passband Flatness
- Analog and Digital Filtering
- Relevant NI Links
Bandwidth & Sample Rate
The bandwidth of a signal generator is the frequency at which the output signal is attenuated 3 dB relative to the amplitude of a DC or low frequency signal. The bandwidth of a signal source is limited by the output amplifier design or by filters in the analog output circuit. Bandwidth is one of the factors that determines the signal generator’s maximum output frequency.
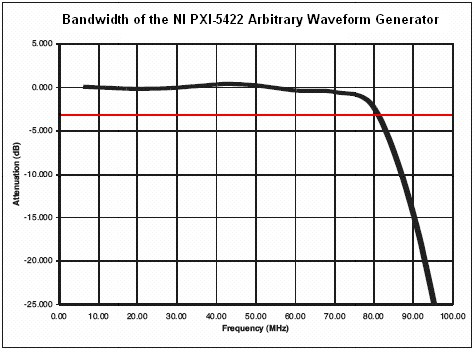
Figure 1
For example, Figure 1 shows the frequency response of the NI PXI-5422 arbitrary waveform generator. As shown, the bandwidth of the PXI-5422 is 80 MHz, meaning the generator can reliably output signals with a frequency range of 0-80 MHz with less than 3dB attenuation. The frequency components above 80 MHz of any output signal will be attenuated greater than 3 dB.
Sample rate is the rate at which digital data is transferred from the memory to the digital-to-analog converter (DAC). A digital waveform must be updated at least twice as fast as the highest frequency of the desired signal to be accurately generated. Ideally, though, a sample rate many times greater than the signal’s highest frequency produces accurate waveforms. A higher sample rate also captures more waveform details.
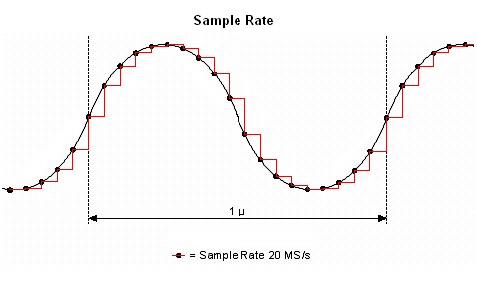
Figure 2
For example, Figure 2 illustrates a 1 MHz sine wave generated by an ideal 20 MS/s DAC. The black line represents the actual sine wave, while the red line signifies the actual signal output from the DAC. Notice that the DAC holds its output voltage until updated. In general, the higher sample rate more accurately defines the waveform shape.
Resolution
The resolution of a signal generator is a limiting factor in determining the accuracy of the generated waveform. More details are present in the waveform if the DAC resolution is increased. A 3-bit DAC divides its vertical range into eight discrete levels. With a vertical range of 0-10 V, the 3-bit DAC cannot generate voltage differences smaller than 1.25 V. In comparison, with an output range of 0-10 V, a 16-bit DAC with 65,536 (or 216) discrete levels can generate voltage differences as small as 153 µV.
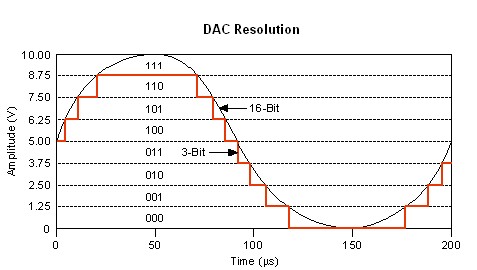
Figure 3
For example, Figure 3 shows the difference between two waveforms. The waveform with 16-bit resolution looks like a continuous sine wave, but when zoomed in, there would be discrete steps of 153 µV. Both waveforms are composed of discrete voltage steps with the 16-bit version looking much closer to a "pure" continuous-time sine waveform.
To find the smallest discrete step of a waveform output from a signal generator, use the following formula where R is the peak to peak voltage range of the DAC and N is the resolution:

To illustrate, the NI PXI-5421 arbitrary waveform generator has 16 bit resolution and can output a signal with a peak to peak voltage range of 0.00564 V when the maximum output attenuation is applied. The PXI-5421, therefore, can output signals with discrete voltage steps as small as 0.086 µV.
Most signal generators offer both variable peak to peak output voltage ranges and offsets that allow the user to take full advantage of the DAC.
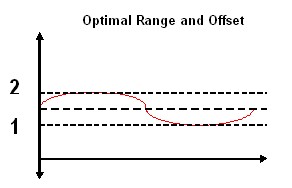
Figure 4
As shown in Figure 4, to output a 1 V peak to peak sine wave ranging from 1 V to 2, the optimal voltage range and offset would be 1 V and 1.5 V, respectively.
Memory Depth
The memory depth of a signal source specifies how much memory is available to store output waveforms as well as instructions for sequencing those.
Function generators employ direct digital synthesis (DDS) to precisely generate standard waveforms that are repetitive in nature, including sine, TTL, square, and triangular waveforms. Function generators generally have these standard waveforms pre-defined in their memory and additionally have small memory depth that allows the user to define one period of their own output waveform.
Arbitrary waveform generators, on the other hand, often have deep onboard memories that allow users to output complex waveforms. For example, the onboard memory depth for the NI 5421 ranges from 8 MB to 512 MB, which translates to 4 million and 256 million samples, respectively. With these onboard memory depths, you can store large and complex user-defined waveforms or waveforms acquired from deep-memory digitizers. With the memory depth of 256 million samples, the user can output a 2.56 second, 16 bit signal at 100 MS/s!
The deep memory of an arbitrary waveform generator can store several different waveform segments as well as instructions on both how to sequence the output of these segments and how many times to output each segment.
Spurious Free Dynamic Range
Dynamic range quantifies the relationship between the largest signal and the smallest signal that can be generated at the same time. Imagine three people in a room where one person is shouting, one is whispering, and the third is listening. Dynamic range would quantify the greatest range between the shouting and whispering that the listener could hear. At some point, the shouting would “drown out” the whispering and the listener could no longer hear what was whispered. At this point, the dynamic range was exceeded. The same is true with electronics that generate or acquire electrical signals.
Spurious free dynamic range (SFDR) is the usable dynamic range before spurious noise interferes with or distorts the fundamental signal. SFDR is the ratio between the fundamental signal and the largest harmonically or non-harmonically related spur from DC to half the sampling rate.
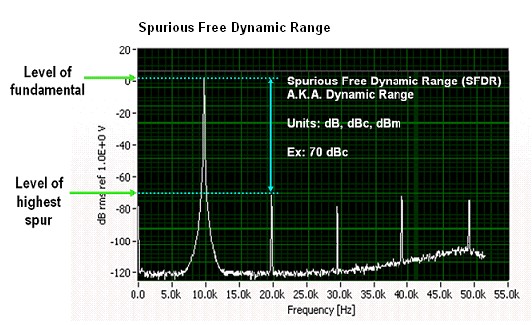
Figure 8
To measure the spurious free dynamic range of a signal generator, a tone is generated a given frequency. A spectrum analyzer is then used to measure the amplitude of the fundamental tone and the amplitude of the next highest tone.
Given decibels, it is easy to calculate SFDR:
In Figure 8, the second harmonic is the second highest tone and the SFDR is approximately 70 dBc. SFDR is most commonly measured in units of “dBc” meaning “dB referenced to a carrier level.” To say that SFDR is 70 dBc implies that the spurious signals will always be 70 dB less than the carrier frequency, and in this case, the fundamental frequency of the sine wave. To put this in perspective, the spurious signals will always be less than 0.00000001 times the fundamental frequency.
Given RMS voltages, SFDR can be calculated with the following equation:

Total Harmonic Distortion
All analog electronics have harmonic distortion. Essentially, generating a tone at a given frequency causes the electronics to resonate (or hum) at integer multiples of the tone. Total harmonic distortion sums together the power in each of the harmonics and divides this by the power in the fundamental. When the THD of a signal approaches -30 dB, the time domain waveform will appear visible distorted.
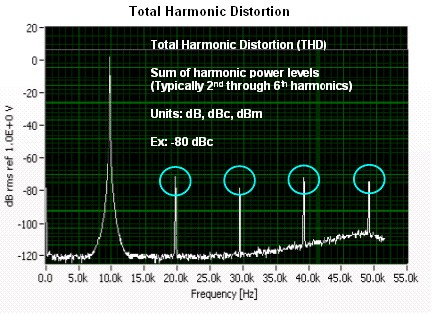
Figure 9
It is most convenient to calculate THD when given the RMS amplitudes of the fundamental frequency, Af, and the 2nd to Nth-order harmonics, An, using the following equation:
Signal-to-Noise Ratio and Effective Number of Bits
Signal-to-noise and distortion ratio (SINAD) is the ratio of the RMS signal amplitude to the RMS sum of all other spectral components, including the harmonics but excluding DC. SINAD is usually expressed in dB.
The signal-to-noise ratio (SNR) is the ratio of the desired signal amplitude to the noise signal amplitude at a given point in time. SNR, like SINAD, is usually expressed in dB. SINAD, in fact, is the sum of the SNR and the THD.
SINAD can be calculated using the following formula using the RMS amplitude of the output signal ASignal and RMS sum of all spectral components below the Nyquist Frequency, ANoise+Distortion:

Naturally, the higher the SINAD the better the quality of the output signal.
The Effective Number of Bits (ENOB) measures the actual performance of the DAC within a signal source after its various noise sources and non-linearity are included and can be calculated directly from SINAD. For example, an ideal 16 bit waveform generator would have an ENOB of 16 bits. Real world signal generators, however, suffer from noise and distortion caused for various reasons including the D/A converter, multiplexing, impedance mismatches, and capacitor settling times.
The easiest way to measure ENOB is to use SINAD measured in dB:
Phase Noise
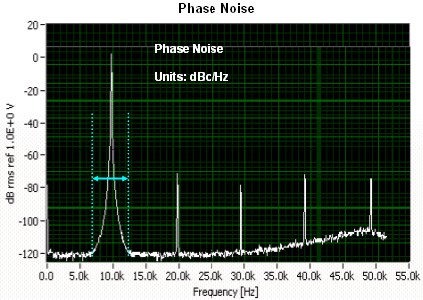
Ideally, when a tone is generated, all of the energy lies exactly at the frequency. However, due to sample clock jitter, energy “bleeds” into the frequencies adjacent to the tone. With jitter, sometimes the sample clock is a bit too fast which increases the frequency of the waveform and sometimes it’s a bit too slow which decreases the frequency. This causes the distribution of frequencies around the fundamental as shown below in Figure 11.
Figure 11
Passband Flatness
All electronics tend to amplify or attenuate certain frequencies. If a signal occupies several different frequencies over a wide range, the signal will be distorted since different frequencies will be attenuated or amplified by different factors. Since communications signals can occupy large ranges of frequencies (say, 10 MHz) they are especially susceptible to this type of distortion.
Passband flatness is a term expressed in dB to specify the limits within which the amplitude of a signal varies across a given frequency range. Ideally a signal generator would have 0 dB passband flatness throughout its entire bandwidth, but the best generators can attain 0.25 dB over most of their bandwidth.
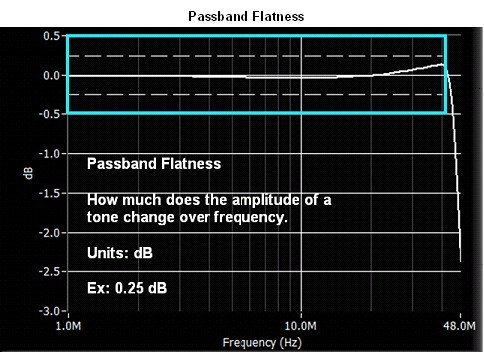
Figure 10
As seen in Figure 10, the passband flatness for the NI PXI-5421 varies as the frequency increases. Also notice the sharp roll-off after the 43 MHz bandwidth.
Analog and Digital Filtering
As explained earlier, a digital waveform must be updated at least twice as fast as the highest frequency of the desired analog signal to be accurately generated. Even though the theoretical requirement for sample clock, fs, is twice that of the signal bandwidth, f0, images are introduced in the output signal at |f0 ± nfs|, as shown in the Figure 11. The images degrade the spectral purity of the signal, creating the need to filter these images out of the signal.
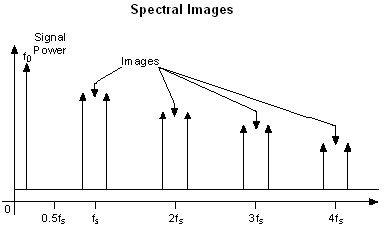
Figure 11
To create quality signals, most signal generators have the ability to lowpass filter the signal being generated. A lowpass filter is used to smooth the raw DAC output. The filter removes high-frequency aliased components that are introduced through the digital generation of the signal. You can implement the lowpass filter through both analog and digital filters.
Designing an analog filter that rejects the images and yet gets maximum output bandwidth (0 to 0.43fs) is difficult and near impossible, and is represented in Figure 6 by the curve, Analog Filter 1. Analog Filter 2 represents a more practical filter. This filter is not as aggressive as Analog Filter 1. Analog Filter 2 does not filter out the images near fs, but it does reject all the others. Analog filters have trade-offs between the roll-off of the attenuation after the 3 dB point and the flatness of the attenuation before the 3 dB point.
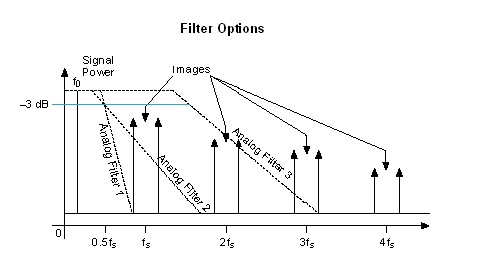
Figure 12
The third filter, Analog Filter 3, has a much higher 3 dB point than the first two analog filters. Because of the higher 3 dB point, the filter is very nearly flat in the passband (0 to 0.43fs). Analog Filter 3 does not filter the images produced at fs and 2fs at all, but this shortcoming can be alleviated with a digital interpolation filter.
To ease the requirements of the analog filter and to get more output bandwidth, signal generators often use digital filters to interpolate data between the stored waveform data. For example, in a 2x interpolation, the DAC would interpolate 1 point between each digital sample. Most NI Signal Generators offer 2x, 4x, and 8x interpolation options. To generate the most spectrally pure signals using the digital filter, you should use the highest interpolation factor that you can.
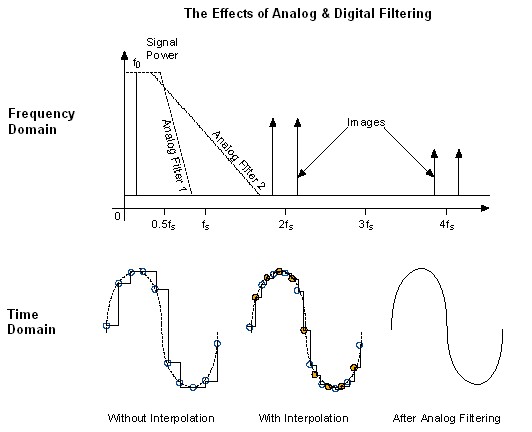
Figure 13
In Figure 13, the two times interpolating filter is used and the effective sample rate of the DAC is 2fs. The images at fs ± f0 are no longer an issue, and the images are now at |2fs ± f0|.
Now, Analog Filter 2 can easily filter out all the images due to the digital generation of the signal. This behavior is seen in the frequency domain representation and in the time domain.
Relevant NI Links
Customers interested in this topic were also interested in the following NI products:

