Sensor Calibration with TEDS Technology
Overview
The IEEE 1451.4 standard describes the Transducer Electronic Data Sheet (TEDS) smart sensor interface. TEDS is a compact set of data describing transducer characteristics, such as excitation values or valid measurement ranges. TEDS can be stored in one of two forms: in an electrically readable memory (EEPROM) embedded within the sensor itself (a “smart sensor”) or in a special file known as Virtual TEDS (VTEDS). VTEDS files can be associated with any transducer, regardless of whether they contain an EEPROM or not, and contain the same binary information. The smart sensors enable plug-and-play operation with a measurement system through the use of a mixed-mode interface and a special circuit capable of transmitting both the analog sensor signals and digital information. The information stored in TEDS enables the system to identify, characterize, interface, and properly use the signal from the analog sensor.
In addition to such configuration information as maximum and minimum electrical values, required for initial setup, TEDS can store calibration data specific to an individual sensor. In many cases, this calibration information will allow the transducer to outperform the manufacturer’s specifications. Gain and offset errors due to factors such as temperature drift and system age can be compensated for using custom calibration figures stored in the TEDS (or VTEDS) file. National Instruments leverages all the features of TEDS technology with NI-DAQmx driver software. This document discusses the features and benefits of custom sensor calibration using TEDS and DAQmx in the LabVIEW development environment.
In addition to such configuration information as maximum and minimum electrical values, required for initial setup, TEDS can store calibration data specific to an individual sensor. In many cases, this calibration information will allow the transducer to outperform the manufacturer’s specifications. Gain and offset errors due to factors such as temperature drift and system age can be compensated for using custom calibration figures stored in the TEDS (or VTEDS) file. National Instruments leverages all the features of TEDS technology with NI-DAQmx driver software. This document discusses the features and benefits of custom sensor calibration using TEDS and DAQmx in the LabVIEW development environment.
Contents
- Calibration Background
- TEDS Calibration Templates
- Calibration Example: K-Type Thermocouple
- Conclusion
Calibration Background
At the core of data acquisition is a voltage measurement from an analog transducer, whether it is an RTD, accelerometer, strain gauge, etc. It is how the data acquisition system interprets the voltage signal based on information about the transducer that makes the measurement intelligible. In the transition from raw voltage to meaningful data, the DAQmx driver applies a variety of conversions depending on the type of transducer. Typically, these are standard curves and equations specific to the type of transducer. Sensor calibration, however, takes this process one step farther by considering transducers on an individual basis. In other words, the sensor output voltage is mapped to a physical measurement based on metrics obtained from a specific sensor calibration.
TEDS Calibration Templates
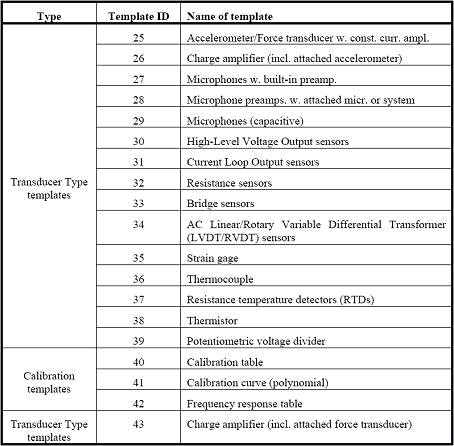
The data stored in the sensor’s EEPROM or a VTEDS file is compressed to save space. To retrieve and interpret the information, the DAQmx driver applies a template to the binary data. There are separate templates for each type of sensor from charge amplifiers to thermistors. In addition to these sixteen standard templates, there are three calibration templates: a calibration table, calibration curve (polynomial), and frequency response table. See Table 1 below.
Table 1. IEEE 1451.4 Standard Templates
The calibration table template describes a lookup table with the electrical-to-physical transfer function of a transducer. The table requires multiple sets of values for the CalPoint_DomainValue and CalPoint_RangeValue parameters. See Table 2 below.
Table 2. Calibration Table Template (ID = 40) Summary

CalTable_Domain is used to select the domain parameter for the calibration table as either electrical (0) or physical (1). For example, an electrical domain parameter would be voltage, whereas a physical domain parameter would Celsius. CalPoint_DomainValue is the domain parameter for the calibrated value, expressed as a percentage of the full range of the transducer. If a thermocouple has a full range of -300 to 300°C, then CalPoint_DomainValue would be 50% if the thermocouple were to be calibrated at 0°C. CalPoint_RangeValue is the deviation of the range measurement from the expected value, expressed as a percentage of the full range of the transducer. A reading that is off by 5°C would correspond to a CalPoint_RangeValue of .8333% for the same thermocouple. Figure 1 below illustrates the use of these properties to specify the transfer function of the transducer.
Figure 1. Calibration Table Transfer Function
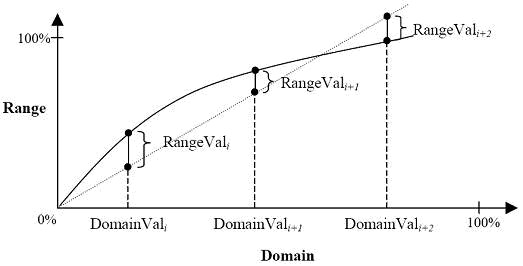
The calibration table template provides a simple means of recording a few data points for calibration purposes. This is particularly useful when calibrating around a very narrow range of values.
Sometimes, however, it is necessary to precisely characterize a transducer over its entire range. This may prove difficult, especially in the case of a transducer with a highly nonlinear transfer function, such as a thermocouple. Accordingly, TEDS provides an alternative means of calibration. The calibration curve template specifies a multi-segment polynomial curve describing the electrical-to-physical transfer function of a transducer. See Table 3 below.
Table 3. Calibration Curve Template Template (ID = 41) Summary

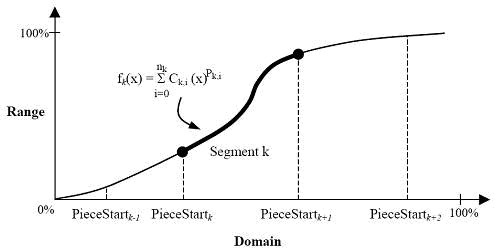
The overall function is described in a piecewise manner, each segment defined by an array of coefficients and powers. For example, a curve may be described by [(3,1),(2,5),(1,-2),(0,1)], where the numbers in parentheses are interpreted as (CalCurve_Power,CalCurve_Coef). This would translate to the polynomial function f(x) = x3 + 5x2 – 2x + 1. See Figure 2 below.
Figure 2. Calibration Curve Transfer Function

|
To make effective use of the calibration curve template, several calibration points must be taken and then fitted to a polynomial curve. This may take significantly more time than collecting a few data points for a calibration table. However, the tradeoff is greater accuracy and a wider range of calibrated values.
Some measurements may require information beyond the time domain. The frequency response transfer function of a transducer is particularly useful for microphones and accelerometers. The frequency response of any vibration transducer, in fact, is very important when comparing readings. Sensors with a broader frequency response will see more vibration if it is present than a narrower bandwidth transducer.
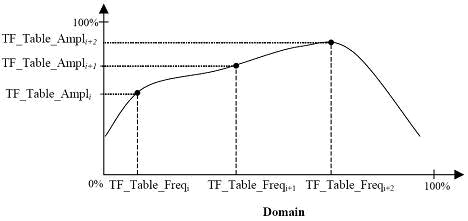
The frequency response table template specifies the frequency response transfer function of a transducer with a lookup table of frequency-amplitude pairs. Similar to the CalTable and CalCurve properties, TF_Table_Freq and TF_Table_Ampl define data points in the amplitude-versus-frequency transfer function. See Table 4 and Figure 3 below.
Table 4. Frequency Response Table Template (ID = 42) Summary

Figure 3. Frequency Response Transfer Function

Any combination of these calibration templates may be used; however, each is tailored to a different type of measurement. Calibration tables offer an easy means of thoroughly characterizing a narrow range of transducer readings. Calibration curves completely specify the range of transducer, though they require more effort due to the calculation of a polynomial from discrete measurements. Frequency response tables may be combined with either of the first two templates to provide more information about the dynamic response of a transducer.
Calibration Example: K-Type Thermocouple
A thermocouple provides a simple means for demonstrating the use and practicality of the TEDS calibration templates, specifically the calibration table template (ID 40). As mentioned above, this template consists of several sets of values (CalPoint_DomainValue and CalPoint_RangeValue) specifying points on the transfer function curve.
Typical calibration points for a thermocouple include the freezing point of water (0°C), the boiling point of water (100°C), and 270°C among others. To calibrate the transducer these temperature readings must be mapped to their corresponding voltages. To ensure consistency and standardization, the data from the thermocouple must be compared against a NIST-traceable source, in this example an SPRT (standard platinum resistance thermometer). Then, any deviation from the expected temperature can be recorded in the calibration table.
For example, if the SPRT reads 75°C in a temperature bath and the thermocouple reads 72°C, the thermocouple is off by 3°C or .184% of its full range (-260°C – 1372°C). Similarly, since 72°C is 10.17% of the domain (-260°C – 1372°C), CalPoint_DomainValue is equal to 10.17% and CalPoint_RangeValue is equal to .184% for this calibration point. This process may be repeated for as many calibration points as desired.
Once the calibration data points have been collected, they should be written to the TEDS EEPROM on the thermocouple or stored in a Virtual TEDS (VTEDS) file. In general, it is a good idea to write the data to a VTEDS file first and test the results before writing it to the EEPROM. The TEDS add-on library for LabVIEW 7.1 provides the VI’s necessary to create the TEDS data. Specifically, the Create New TEDS Template palette under NI Measurements » TEDS » Advanced TEDS contains the calibration template VI’s. See Figure 4 below.
Figure 4. Create New TEDS Template Function Palette

Note that this document does not contain specific information on the TEDS VI’s. Refer to the Related Links section for more detailed information and a completed example.
With the calibration data collected and written to file, it may be applied to any measurement using the thermocouple through the use of the DAQmx Configure TEDS.vi. The DAQmx driver will automatically read in the calibration information and apply it to all subsequent transducer measurements until the acquisition is complete. The DAQmx TEDS-related VI’s are located under NI Measurements » DAQmx – Data Acquisition » DAQmx Advanced » DAQmx TEDS.
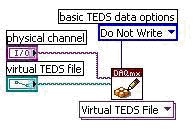
The last step is to write the TEDS data to the EEPROM of the sensor, so that the calibration data may be used by other data acquisition systems. The DAQmx Write TEDS Data.vi (new as of DAQmx 7.3) will accept either a TEDS binary bit stream or a VTEDS file path as an input. Refer to Figure 5 below.
Figure 5. Write VTEDS Data to Transducer EEPROM
Refer to the Related Links section below for a more complete example of thermocouple calibration with TEDS.
Conclusion
The benefits of plug-and-sensors are numerous. Reduced setup time and auto-configuration can increase productivity and reduce the overall cost of a measurement system. The calibration templates offered with the TEDS interface provide a means of characterizing transducers on an individual basis. This detailed calibration can lead to increased accuracy beyond the published specifications for a given sensor type. National Instruments provides a complete solution for a TEDS acquisition system, including data acquisition hardware and software. Refer to the related links below for more information.