Acquiring and Analyzing EEG Signals With DAQ and LabVIEW
Aleksandar Popović, UNO-LUX NS d.o.o.
"An NI PCI-6220 board and LabVIEW were logical choices for developing a system for EEG acquisition, analysis, and presentation. With a PCI-6220 board, our system directly accepts signals from a signal amplifier, and the huge library of signal processing and analysis functions in LabVIEW significantly simplified development and increased application development speed."
- Aleksandar Popović, UNO-LUX NS d.o.o.
The Challenge:
Developing a system for electroencephalogram (EEG) acquisition, analysis, and presentation, according to user-defined demands, for the Neurophysiology Laboratory at the Institute for Medical Physiology at Belgrade University School of Medicine.
The Solution:
Using an NI PCI DAQ device to directly accept signals from an amplifier and using the huge library of signal processing and analysis functions in NI LabVIEW to significantly simplify development and increase application-development speed.
Author(s):
Aleksandar Popović - UNO-LUX NS d.o.o.
Zoran Ignjatović - UNO-LUX NS d.o.o.
Introduction
Researchers from Medical Faculty monitor brain activity on the rats while giving them different drugs. It was necessary to replace old equipment. One solution was to purchase a new dedicated equipment which was quite expensive, and the other one was to use the appropriate acquisition card and develop application software for their needs, what we did.
System Setup
We used an NI PCI DAQ device and NI LabVIEW to develop a system that acquires and analyzes EEG signals. We connected the signals from an existing preamplifier to the DAQ board inputs. The board processes and analyzes the recorded signals. We can extract parts of the signal (epochs) to filter it and perform spectral analysis by calculating average fast Fourier transform (FFT) and time FFT.
Because an EEG signal is not a steady signal, we must use analysis methods that offer information about the signal in the time-scale domain. Therefore, we applied short time FFT and continuous, discrete wavelet transformation. For this analysis, we used prebuilt LabVIEW functions. A rich library of prebuilt signal processing and analysis functions is one advantage of LabVIEW, compared to other programming languages. You can generate reports and export signals in JPEG and MS Excel formats.
For signal calibration, the user must select a calibration option from the main menu and set the duration and number of channels. The calibration data remains in the system’s memory until it performs the next calibration. After the user chooses to acquire new signals, a window opens with the option to specify one of eight animals. The user can add or remove animals. Every new record related to newly treated animals has the following options:
- Treatment: This is the treatment performed on the animal. The user can select from the list of treatments or create a new one. After the acquisition and signal logging finishes, the treatment is represented by a folder in the signal library.
- Name: This is the name of the animal undergoing the EEG. After the acquisition and signal logging completes, this folder is saved under the corresponding treatment folder. The recorded signals save to this folder and have the animal’s name in the file name.
- Channels: The user can select one to three channels for every animal. Each channel is assigned a certain name, and all channels are saved under the animal’s file.
- Description: This is a text description assigned to an animal or measurement.
After entering the specifics about the animal, the user can start the acquisition. Signals pass through two software filters: a lowpass filter and a notch filter. Initially, they are not logged to the hard drive. To start saving the signals, the user selects the logging option from the menu. An indicator in the upper-right corner of the window displays logging status. If the indicator is red, logging is turned off, but if it is green, logging is in progress.
During logging, the user can add markers to the signals. A marker is assigned to one animal and is described by the time moment and text. Actions that execute on the markers include adding, modifying, deleting one marker, and deleting all markers for the corresponding animal. The system saves markers to a file where the signal is saved, and opens them together with the signal. The user can change marker appearance as well as add, change, or delete markers from the main window after the signal is opened from the file and during acquisition.
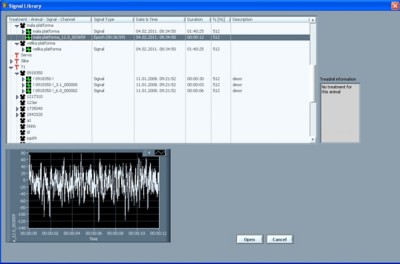
When the signal is read from the file, the signal library window opens (see Figure 1). The structure of the signals library shows in the upper part of this window and consists of the following:
- Treatment: This is in the signal library folder.
- Animal: This is in the corresponding treatment folder.
- Signal: Signals are saved in the corresponding animal folder. By default, the .eeg file has the same name as the animal or epoch, which is also a .eeg file.
- Channel: This is the part of a .eeg file for a signal or an epoch that does not exist as a separate item in the library when the signal or epoch has only one channel.
When clicking any item that represents a signal, epoch, or channel, a small screen shows a representation of the selected signal. After the user selects the desired signal, epoch, or channel and presses the Open button, one or more graphs display on the main application window.
The cursors are straight lines on graphs that the user can move and place at specific positions. The cursors have two basic functions: to read the value of a signal at a specific point on the graph at a specific moment, and to mark certain parts of the signal between them so that the system can perform certain operations on that segment rather than on the entire signal.
The system can conduct each analysis if the user selects the proper option from the Analyze submenu in the application main menu. Choosing the mean FFT option opens the signal library window, where the user selects one or more channels of an epoch. By clicking the Add Epoch button, an epoch is added to the selected signals. The user can remove them by pressing the Remove Epoch button. All selected epochs have the same sampling frequency and duration.
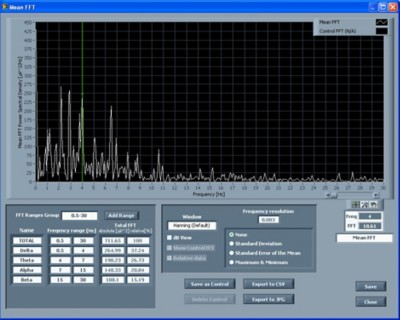
After the user presses the Analyze button, a new window opens with the average FFT displayed in a graph (see Figure 2). The user can set a large number of parameters, and the system can remember opened epochs and controlled epochs. When the user selects the Time FFT option, a signal library window appears. Then the user can select one or more groups with one or more channels of epochs. A group of epochs represents one column in the table and describes one moment in the time FFT. The system averages the epochs inside one column, which describes the complete FFT for one moment in time. All selected epochs in one group (column) have the same sampling frequency and duration. Also, in the signal library window, the time difference between the two groups of epochs can be defined (delta T). When the user presses the Analyze button, a new window opens with a timed FFT on the graph. Choosing the Time FFT option from the main application menu performs a timed FFT analysis of the opened signal, while choosing Amplitude Histogram generates an amplitude histogram. When the histogram is determined, the system counts the peaks and valleys of a wave and marks them on the graph as green and red dots, respectively.
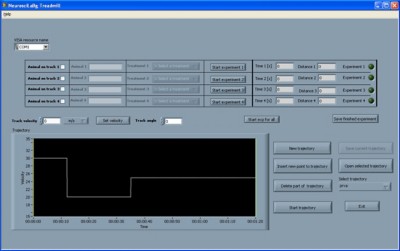
Aside from signal acquisition and analysis, the system controls the treadmill by sending individual commands for direction and speed, or by defining a trajectory (see Figure 3). The system communicates with the treadmill through a serial RS232 interface by sending and receiving text messages.
Conclusion
A PCI DAQ device and LabVIEW were logical choices for developing a system for EEG acquisition, analysis, and presentation. With the NI DAQ device, our system directly accepts signals from a signal amplifier, and the huge library of signal processing and analysis functions in LabVIEW significantly simplified development and increased application development speed.
Products in this Case Study


