Programming with Graph Controls
- Updated2023-02-21
- 12 minute(s) read
Programming with Graph Controls
This topic describes how to complete the following tasks programmatically.
- Annotations
- Associating a plot with a specific axis
- Axes
- Binding to a DataSocket source
- Configuring plot attributes
- Creating a graph control
- Cursors
- Deleting data from a graph
- Enabling zooming
- Graph Legend
- Plotting data to a graph
- Specifying how the graph scales
Creating a Graph Control
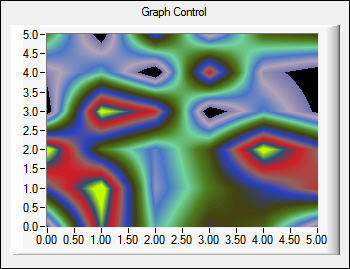
Use NewCtrl to create a graph control.
int graphCtrl;
graphCtrl = NewCtrl (panelHandle, CTRL_GRAPH_LS, "Graph Control", 30, 10);
Plotting Data to a Graph
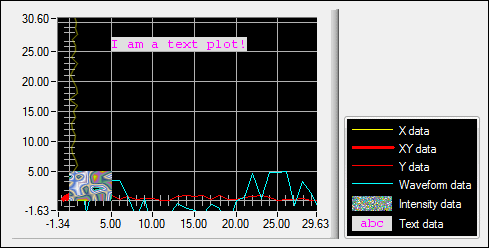
Graph controls can contain a variety of plot types representing different types of data. Use the Graph Plotting and Deleting functions to plot different types of data to a graph control. When you plot data on a graph, you receive a plot handle that you can use in later functions calls to refer to an individual plot.
double xData[100];
int i, xHandle;
for (i=0; i<100; i++)
{
xData[i] = Random (0, 1);
}
xHandle = PlotX (panelHandle, graphCtrl, xData, 100, VAL_DOUBLE, VAL_THIN_LINE, VAL_ASTERISK, VAL_SOLID, 1, VAL_YELLOW);

double xData[100], double yData[100];
int i, xyHandle;
for (i=0; i<100; i++)
{
xData[i] = Random (-1, 1);
yData[i] = Random (0, 1);
}
xyHandle = PlotXY (panelHandle, graphCtrl, xData, yData, 10, VAL_DOUBLE, VAL_DOUBLE, VAL_FAT_LINE, VAL_EMPTY_SQUARE, VAL_SOLID, 1, VAL_RED);

double wfmData[100];
int wfmHandle;
WhiteNoise (100, 5.0, 0, wfmData);
wfmHandle = PlotWaveform (panelHandle, graphCtrl, wfmData, 100, VAL_DOUBLE, 1.0, 0.0, 0.0, 1.0, VAL_FAT_STEP, VAL_EMPTY_SQUARE, VAL_DASH_DOT_DOT, 1, VAL_CYAN);

static void GenerateSampleData (float *plotData)
{
int i = 0, factor = 50;
double rnd = 0;
for (i = 0; i < 40; i++)
{
rnd = (double)rand() / RAND_MAX;
plotData[i] = (float)rnd * factor;
}
}
...
ColorMapEntry colors[COLORMAPSIZE+20];
float plotData[DATASIZE];
int i, intHandle;
GenerateSampleData(plotData);
for (i = 1; i <= COLORMAPSIZE; i++)
{
colors[i-1].color = MakeColor (rand() % 255, rand() % 255, rand() % 255);
colors[i-1].dataValue.valFloat = i * 50 / (COLORMAPSIZE + 1);
}
intHandle = PlotIntensity (panelHandle, graphCtrl, plotData, (int)sqrt (DATASIZE), (int)sqrt (DATASIZE), VAL_FLOAT, colors, VAL_BLACK, COLORMAPSIZE, TRUE, TRUE);

textHandle = PlotText (panelHandle, graphCtrl, 5.0, 25.0, "I am a text plot!", VAL_EDITOR_META_FONT, VAL_MAGENTA, VAL_OFFWHITE);

Deleting Data from a Graph
DeleteGraphPlot removes the specified plot from a graph. If you set the plotHandle parameter to -1, DeleteGraphPlot deletes all plots from a graph.
DeleteGraphPlot (panelHandle, graphCtrl, -1, VAL_IMMEDIATE_DRAW);
The refresh parameter determines whether the plot is immediately removed from the graph or whether the plot remains in the graph until certain actions take place. In the following example, the refresh parameter is set to VAL_DELAYED_DRAW, and the plot is removed after the plot area is exposed.
DeleteGraphPlot (panelHandle, graphCtrl, -1, VAL_DELAYED_DRAW);

The way the graph refreshes can affect graphing speed. Refer to the Optimizing Speed and Performance of a Graph Control topic for more information.
Specifying How the Graph Scales
// Specify the minimum and maximum range of the axis.
SetAxisScalingMode (panelHandle, PANEL_GRAPHMAN, VAL_LEFT_YAXIS, VAL_MANUAL, 0, 15);

// Specify that the graph should autoscale.
SetAxisScalingMode (panelHandle, graphCtrl, VAL_LEFT_YAXIS, VAL_AUTOSCALE, 0, 0);

/* Specify that the graph should use minimum and maximum values based on previously plotted data. */
SetAxisScalingMode (panelHandle, PANEL_GRAPHMAN, VAL_LEFT_YAXIS, VAL_LOCK, 0, 5);

Call GetAxisScalingMode to obtain the current scaling mode and range of one of the axes of a graph control.
Enabling Zooming
You can set different zoom styles to allow the user to examine graphs in different ways.
/* Zoom into a plot by defining a rectangular zone that will become the new limits of the graph. */
SetCtrlAttribute (panelHandle, graphCtrl, ATTR_ENABLE_ZOOM_AND_PAN, 1);
SetCtrlAttribute (panelHandle, graphCtrl, ATTR_ZOOM_STYLE, VAL_ZOOM_TO_RECT);

// Zoom along the x-axis.
SetCtrlAttribute (panelHandle, graphCtrl, ATTR_ENABLE_ZOOM_AND_PAN, 1);
SetCtrlAttribute (panelHandle, graphCtrl, ATTR_ZOOM_STYLE, VAL_ZOOM_XAXIS);

To focus on the y-axis, use VAL_ZOOM_YAXIS instead.
// Zoom around a single point.
SetCtrlAttribute (panelHandle, graphCtrl, ATTR_ENABLE_ZOOM_AND_PAN, 1);
SetCtrlAttribute (panelHandle, graphCtrl, ATTR_ZOOM_STYLE, VAL_ZOOM_AROUND_PT);

Associating a Plot with a Specific Axis
After you add a plot to a graph, you can associate it with the other axis. In the following example, pass the plot handle obtained with the PlotText function.
SetPlotAttribute (panelHandle, graphCtrl, textHandle, ATTR_PLOT_YAXIS, VAL_RIGHT_YAXIS);
Configuring Plot Attributes
You can customize individual plots by setting attributes on a given plot handle using SetPlotAttribute.
Specifying Which Axes Are Visible
A graph always contains two x-axes and y-axes. By default, only the bottom x-axis and left y-axis are visible.
// Make the top x-axis visible.
SetCtrlAttribute (panelHandle, graphCtrl, ATTR_ACTIVE_XAXIS, VAL_TOP_XAXIS);
SetCtrlAttribute (panelHandle, graphCtrl, ATTR_XLABEL_VISIBLE, 1);
// Make the right y-axis visible.
SetCtrlAttribute (panelHandle, graphCtrl, ATTR_ACTIVE_YAXIS, VAL_RIGHT_YAXIS);
SetCtrlAttribute (panelHandle, graphCtrl, ATTR_YLABEL_VISIBLE, 1);

Specifying the Active Axis
By default, the bottom x-axis and the left y-axis are the active axes. The ATTR_ACTIVE_XAXIS and ATTR_ACTIVE_YAXIS attributes determine which of the two axes are used for the following actions:
- Adding a plot to the graph—The active axis serves as the scaling reference.
- Setting an axis attribute—Each axis has its own attribute values.
- Setting the axis range—Each axis has its own range.
- Creating a graph cursor—The cursor is associated with the active axis.
/* Specify the top x-axis as active. */
SetCtrlAttribute (panelHandle, graphCtrl, ATTR_ACTIVE_XAXIS, VAL_TOP_XAXIS);
/* Specify the right y-axis as active. */
SetCtrlAttribute (panelHandle, graphCtrl, ATTR_ACTIVE_YAXIS, VAL_RIGHT_YAXIS);
Specifying the Display Format of Axes
Use ATTR_XFORMAT and ATTR_YFORMAT to specify the display format of the x-axis and y-axis values.
SetCtrlAttribute (panelHandle, PANEL_GRAPHMAN, ATTR_XFORMAT, VAL_SCIENTIFIC_FORMAT);
Specifying Dates and Times for Axis Values
To display date/time data, set the display format.
// Set absolute time.
SetCtrlAttribute (panelHandle, graphCtrl, ATTR_XFORMAT, VAL_ABSOLUTE_TIME_FORMAT);
SetAxisTimeFormat (panelHandle, graphCtrl, VAL_BOTTOM_XAXIS, VAL_ABSOLUTE_TIME_FORMAT, "%X %B %#d, %Y");
If you use the absolute time format, LabWindows/CVI expects that you plot data that contains the number of seconds since January 1, 1900. This format is compatible with the format the time and GetCurrentDateTime functions use.
// Set relative time.
SetCtrlAttribute (panelHandle, graphCtrl, ATTR_XFORMAT, VAL_RELATIVE_TIME_FORMAT);
SetAxisTimeFormat (panelHandle, graphCtrl, VAL_BOTTOM_XAXIS, VAL_RELATIVE_TIME_FORMAT, "%#M:%S.%3f");
If you use the relative time format, LabWindows/CVI expects that you plot data that contains the number of seconds since some arbitrary point in time, commonly denoted as t0. For example, you might use the start of a data acquisition process as the arbitrary point in time.
Formatting Dates and Times
You can call SetAxisTimeFormat to change the format string that specifies how the date/time is displayed on the specified axis. The format string can contain the specifiers that the ANSI C strftime function supports. You also can use an additional specifier, %nf, which represents the fractional part of the seconds, and the @ modifier, which restricts overflow for certain time units.
When the axes are in absolute time or relative time format, the value you specify for ATTR_XAXIS_OFFSET or ATTR_YAXIS_OFFSET is the t0 value. The value you specify for ATTR_XAXIS_GAIN or ATTR_YAXIS_GAIN is the Δt value. Call MakeDateTime or GetCurrentDateTime to obtain time values you can use as ATTR_XAXIS_OFFSET and ATTR_YAXIS_OFFSET values. You also can pass time values to SetAxisScalingMode min and max when you configure an axis for manual scaling.
Enabling Editable Axis Labels
SetCtrlAttribute (panelHandle, PANEL_GRAPHMAN, ATTR_ENABLE_EDITABLE_AXES, 1);
The preceding code allows users to edit graph axis values at run time. If you enable this attribute, a user can double-click the minimum or maximum axis label value to edit it. When the user modifies the value, the axis range changes based on the new value.
 |
Note This functionality is available only if the graph is in normal or hot mode and you set the axis scaling mode to VAL_MANUAL or VAL_LOCK. If you enable ATTR_XUSE_LABEL_STRINGS or ATTR_YUSE_LABEL_STRINGS, you cannot use editable axis labels. If you set ATTR_XFORMAT or ATTR_YFORMAT to VAL_RELATIVE_TIME_FORMAT or VAL_ABSOLUTE_TIME_FORMAT, you also cannot use editable axis labels. |
Customizing Axis Labels
/* Replace the numeric labels of graph axes with custom text labels. */
PlotLine (panelHandle, PANEL_GRAPH, 0.0, 0.0, 100.0, 100.0, VAL_CYAN);
SetCtrlAttribute (panelHandle, PANEL_GRAPH, ATTR_XUSE_LABEL_STRINGS, 1);
InsertAxisItem (panelHandle, PANEL_GRAPH, VAL_BOTTOM_XAXIS, -1, "Starting Point", 0.0);
InsertAxisItem (panelHandle, PANEL_GRAPH, VAL_BOTTOM_XAXIS, -1, "Mid Point", 50.0);
InsertAxisItem (panelHandle, PANEL_GRAPH, VAL_BOTTOM_XAXIS, -1, "Ending Point", 100.0);

Use the GetAxisItem, ReplaceAxisItem, and DeleteAxisItem functions to manipulate the label/value pairs that you add as custom axis labels.
Each individual string displays only when its associated value falls within the range of the axis.
Configuring the Appearance of the Axes Names
You can customize the appearance of the x- and y-axis names using the ATTR_XYNAME... attributes.
SetCtrlAttribute (panelHandle, graphCtrl, ATTR_XNAME, "Top X Axis");
SetCtrlAttribute (panelHandle, graphCtrl, ATTR_YNAME, "Left Y Axis");
SetCtrlAttribute (panelHandle, graphCtrl, ATTR_XYNAME_BOLD, 1);

Displaying the Graph Legend
The graph legend displays plots from the graph. By default, the legend does not appear for graph controls that you create programmatically.
SetCtrlAttribute (panelHandle, graphCtrl, ATTR_LEGEND_VISIBLE, 1);
Customizing the Graph Legend
// Set the label of plots in the legend.
SetPlotAttribute (panelHandle, graphCtrl, textHandle, ATTR_PLOT_LG_TEXT, "Text data");

If you disable ATTR_LEGEND_AUTO_DISPLAY, you can still control whether a given plot is included in the legend:
SetPlotAttribute (panelHandle, graphCtrl, intHandle, ATTR_PLOT_LG_VISIBLE, 1);
When you delete a plot from the graph, LabWindows/CVI also removes it from the legend.
By default, the legend sizes itself automatically whenever you add or remove a new item.
// Specify the size of the graph legend.
SetCtrlAttribute (panelHandle, graphCtrl, ATTR_LEGEND_AUTO_SIZE, 0);
SetCtrlAttribute (panelHandle, graphCtrl, ATTR_LEGEND_HEIGHT, 80);
SetCtrlAttribute (panelHandle, graphCtrl, ATTR_LEGEND_WIDTH, 150);
SetCtrlAttribute (panelHandle, graphCtrl, ATTR_LEGEND_TOP, VAL_BOTTOM_ANCHOR);
The graph legend includes a context menu that gives users the ability to edit plot attributes at run time.
SetCtrlAttribute (panelHandle, graphCtrl, ATTR_LEGEND_INTERACTIVE, 1);

 |
Note The customization menu is unavailable if the graph is in indicator mode. |
Customizing the Graph Legend Context Menu
/* Add and remove built-in items from the context menu. */
HideBuiltInCtrlMenuItem (panelHandle, graphCtrl, VAL_PLOT_COLOR);
HideBuiltInCtrlMenuItem (panelHandle, graphCtrl, VAL_PLOT_ORIGIN);
ShowBuiltInCtrlMenuItem (panelHandle, graphCtrl, VAL_PLOT_FONT, -1);
ShowBuiltInCtrlMenuItem (panelHandle, graphCtrl, VAL_PLOT_FILL_COLOR, -1);
ShowBuiltInCtrlMenuItem (panelHandle, graphCtrl, VAL_PLOT_LINE_THICKNESS, -1);
Note that the menu items vary depending on the type of plot you right-click.

/* Add your own items to the context menu. */
void CVICALLBACK CustomMenu (int panelHandle, int controlID, int MenuItemID, void *callbackData);
. . .
NewCtrlMenuItem (panelHandle, graphCtrl, "Delete Plot", -1, CustomMenu, 0);
. . .
/* This custom context menu item deletes the plot that is selected in the graph legend. */
void CVICALLBACK CustomMenu (int panelHandle, int controlID, int MenuItemID, void *callbackData)
{
int activeItem;
GetActiveLegendItem (panelHandle, graphCtrl, &activeItem);
DeleteGraphPlot (panelHandle, graphCtrl, activeItem, VAL_IMMEDIATE_DRAW);
}

You also can use control menu attributes to configure context menus. Call GetCtrlMenuAttribute and SetCtrlMenuAttribute to get and set these attributes.
Adding Cursors to a Graph
Use cursors to select a point or region of the graph.
/* Add a specified number of cursors to the graph */
SetCtrlAttribute (panelHandle, graphCtrl, ATTR_NUM_CURSORS, 3);
Once you add cursors to the graph, refer to them through their one-based indices.
Deleting Cursors
SetCtrlAttribute (panelHandle, graphCtrl, ATTR_NUM_CURSORS, 0);
 |
Note You cannot remove a specified cursor. For example, when you change the value of ATTR_NUM_CURSORS from 5 to 3, the graph control eliminates the final two cursors. |
Associating a Cursor with a Specific Axis
After you create a graph cursor, you can associate it with the other axis. The associated axis serves as the reference for the cursor position coordinates in calls to SetGraphCursor and GetGraphCursor.
SetCursorAttribute (panelHandle, graphCtrl, 1, ATTR_CURSOR_XAXIS, VAL_TOP_XAXIS);
Configuring Cursor Attributes
Specify whether cursors can be placed anywhere on the graph or whether they snap to the nearest plotted point.
SetCursorAttribute (panelHandle, graphCtrl, 1, ATTR_CURSOR_MODE, VAL_FREE_FORM);
SetCursorAttribute (panelHandle, graphCtrl, 2, ATTR_CURSOR_MODE, VAL_SNAP_TO_POINT);
Notice in the figure the blue cursor is attached to a plotted point, while the yellow cursor is not.

SetPlotAttribute (panelHandle, graphCtrl, xHandle, ATTR_PLOT_OPACITY, 100);
Obtaining the Active Cursor
int activeCursor;
GetActiveGraphCursor (panelHandle, graphCtrl, &activeCursor);
Obtaining the Position of a Specified Cursor
double xCurs, yCurs;
GetGraphCursor (panelHandle, graphCtrl, 1, &xCurs, &yCurs);
Adding Graph Annotations
You can use graph annotations to mark specific data points on a graph.
AddGraphAnnotation (panelHandle, graphCtrl, 0.6, 22.7, "Important Point", 20, 20);

Deleting Annotations
// Delete all annotations
DeleteGraphAnnotation (panelHandle, graphCtrl, -1);
Configuring Annotation Attributes
You can customize individual annotations by using annotation attributes, which you can get and set by calling GetAnnotationAttribute and SetAnnotationAttribute.
SetAnnotationAttribute (panelHandle, graphCtrl, 1, ATTR_ANNOTATION_CAPTION_ALWAYS_IN_VIEW, 1);
SetAnnotationAttribute (panelHandle, graphCtrl, 1, ATTR_ANNOTATION_GLYPH_STYLE, VAL_SOLID_CIRCLE);
SetAnnotationAttribute (panelHandle, graphCtrl, 1, ATTR_ANNOTATION_ARROW_STYLE, VAL_LONG_ARROW);
SetCtrlAttribute (panelHandle, graphCtrl, ATTR_CTRL_MODE, VAL_NORMAL);
SetAnnotationAttribute (panelHandle, graphCtrl, 1, ATTR_ANNOTATION_LOCKED, 0);
Obtaining the Index of the Annotation
Identify each annotation by its one-based index.
int annotIndex;
GetAnnotationIndexFromCaption (panelHandle, graphCtrl, "Caption to search", 1, &annotIndex);
Binding to a DataSocket Source
(Linux) Data binding is not supported.
Controls can have only one DataSocket connection. You must specify whether the access mode is READ mode or WRITE mode:
- READ mode—The control gets data from the DataSocket source. In READ mode, the value of the graph control is updated automatically when the value changes at the source.
- WRITE mode—The control transfers data to the DataSocket source. In WRITE mode, the value at the DataSocket source is updated automatically when the value of the graph control changes.
You must enable the DataSocket option in the Edit Installer dialog box Drivers & ComponentsDrivers & Components tab if your applications use data binding.
Binding to a DataSocket Source in the User Interface Editor
Complete the following steps to bind a network variable to a graph control.
- In the Edit Graph dialog box, click the DataSocket Binding button.
- Click the browse button to the right of the Server text box in the DataSocket Binding dialog box.
- Select the network variable you want to bind and click the OK button.
- Select whether you want to read or write data in the Connection Type option.
- Click the OK button.
Binding to a DataSocket Source Programmatically
Use DSBindPlot to bind a specific plot on the graph control to a DataSocket source. If you specify a plot ID at bind time, the access mode must be READ. In this case, the type of plot you specify must be compatible with the data type in the DataSocket source. Valid plot types are X, Y, waveform, point, intensity, scaled intensity, and text. If you do not specify a plot ID at bind time and the access mode is READ, the graph control dynamically creates a plot that matches the data type in the DataSocket source. Use ATTR_DS_BIND... attributes to set initial preferences for this plot.
HRESULT dsError;
static DSHandle dsHandle;
DSBindPlot (panelHandle, graphCtrl, -1, "dstp://localhost/sampletext", &dsHandle, &dsError);
SetCtrlAttribute (panelHandle, graphCtrl, ATTR_DS_BIND_PLOT_COLOR, VAL_GREEN);

Use DSGetBoundPlotID to obtain the plot ID of the graph plot.
int boundPlot;
DSGetBoundPlotID (panelHandle, graphCtrl, &boundPlot);
Use DSUnbind to disconnect the graph control from the DataSocket source.
DSUnbind (panelHandle, graphCtrl, &dsError);
Related Topics
In This Section
- Creating a Graph Control
- Plotting Data to a Graph
- Deleting Data from a Graph
- Specifying How the Graph Scales
- Enabling Zooming
- Associating a Plot with a Specific Axis
- Configuring Plot Attributes
- Specifying Which Axes Are Visible
- Specifying the Active Axis
- Specifying the Display Format of Axes
- Specifying Dates and Times for Axis Values
- Enabling Editable Axis Labels
- Customizing Axis Labels
- Configuring the Appearance of the Axes Names
- Displaying the Graph Legend
- Customizing the Graph Legend
- Customizing the Graph Legend Context Menu
- Adding Cursors to a Graph
- Deleting Cursors
- Associating a Cursor with a Specific Axis
- Configuring Cursor Attributes
- Obtaining the Active Cursor
- Obtaining the Position of a Specified Cursor
- Adding Graph Annotations
- Deleting Annotations
- Configuring Annotation Attributes
- Obtaining the Index of the Annotation
- Binding to a DataSocket Source