Using myDAQ with the NI ELVISmx Oscilloscope Soft Front Panel
Contents
- Overview
- Channel Settings
- Timebase
- Trigger
- Cursors Settings
- Display Measurements
- Instrument Control
- Related Links
Overview
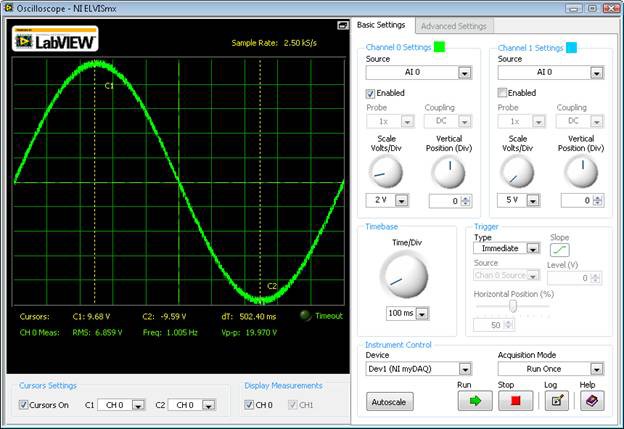
The NI ELVISmx Oscilloscope (Scope) displays voltage data over time for analysis of one or two voltage measurements taken from the analog input channels of the NI myDAQ.
Channel Settings
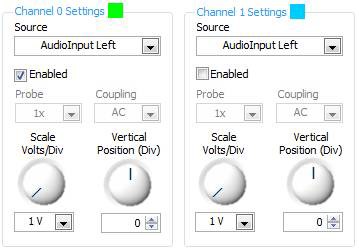
The oscilloscope soft front panel provides scaling and position adjustment knobs for each of two channels independently. The source of each channel can be AI 0, AI 1, AudioInput Left, or AudioInput Right. The two AI channels are the differential inputs from the screw terminals on the side of the myDAQ unit, and the AudioInput channels are measured from the right and left channels of the 3.5mm Audio Input jack on the side of the myDAQ.
Note: While the Oscilloscope can take measurements from either the screw terminal AI inputs or the Audio Input channels, the Scope cannot use both types of inputs at the same time. For example, the scope cannot use AI 0 on channel 0 and AudioInput Right on channel 1.
To enable each channel, click the Enabled box to place a check in it. Below this you’ll notice that the probe setting will always be set at 1x, this is the only probe setting supported by myDAQ. For a different probe setting an NI ELVIS system must be used. You’ll also see that the Coupling option will be set to DC for AI 0 and AI 1 inputs, or AC for the Audio Input channels. This is due to the hardware inside of the NI myDAQ, and cannot be changed.
The final options in the Channel Settings windows adjust the Scale and Vertical position of each channel on the scope. The available options when using a myDAQ are:
Scale (Volts/Division):
5V, 2V, 1V, 500mV, 200mV, 100mV, 50mV, 20mV, and 10mV when using AI Channels
1V, 500mV, 200mV, 100mV, 50mV, 20mV, and 10mV when using AudioInput Channels
Vertical Position (in Divisions): Variable by hundredths from -5 to 5 divisions.
Timebase
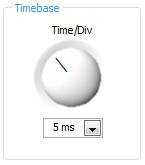
Below the Channel Settings, the Oscilloscope provides a modifiable timebase that allows for the time per division of the scope to be changed. By changing the Time per division, you can zoom in on the signals shown on the oscilloscope. The available timebase options are:
Time per Division: 200ms, 100ms, 50ms, 20ms, 10ms, 5ms, 2ms, 1ms, 500us, 200us, 100us, 50us, 20us, 10us, and 5us.
Trigger
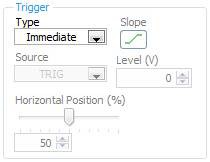
The trigger section gives the option to use either an immediate trigger or an edge trigger. When the Immediate trigger is used, no other trigger configuration is needed. When an edge trigger is used, use the Slope button to select whether to look for a rising or falling edge in the signal, the Source selection box to select which channel to trigger from, the level input to set how large of an edge to look for (in Volts), and the horizontal Position slider to set where the triggered part of the signal should show on the scope.
Cursors Settings
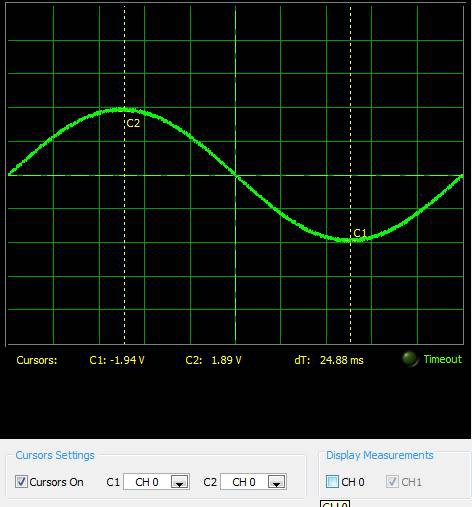
The Oscilloscope Soft Front panel includes two cursors that can be used for more accurate front panel measurements. To enable the cursors simply place a checkmark is the Cursors On selection box. To select which signal each cursor is measuring, use the drop down box next to C1 and C2. To move the cursors, click and drag the dotted yellow lines on the scope front panel. Notice that when the cursors are used, the value of the selected signal at each cursor is shown in yellow on the bottom of the scope display. The difference in time between the two cursors is also shown to help with time measurements.
Display Measurements
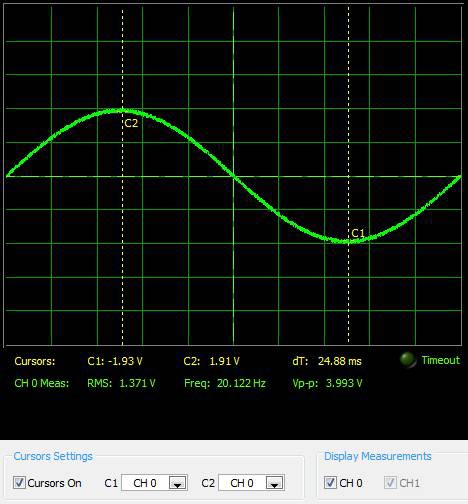
The display measurements selections allow for enabling and disabling RMS, Frequency, and Peak-to-peak voltage measurements on the signals acquired for each channel. These measurements are made on the portion of the signal in the scope window, and are shown on the bottom of the scope display just below where the cursor measurements are displayed when enabled.
Instrument Control
The Instrument Control settings section of the Oscilloscope allows the user to select which device they are using to take a measurement and if they’d like to acquire one sample or acquire continuously. This section also holds autoscale, run, stop and log buttons for the scope, as well as a link to the help section for the Oscilloscope in the NI ELVISmx help.
The device drop down selection box allows a user to select any myDAQ or ELVIS unit that is connected to the system. The device list, which includes the device numbers, is pulled from the devices and interfaces that can be seen in Measurement and Automation Explorer. To test or rename each device, see the Configuring and Testing your myDAQ in Measurement and Automation Explorer page.
The acquisition mode drop down selection box gives two options: run continuously, and run once. When run continuously is selected, the scope will start running as soon as the Run button is pressed, and will continue to make measurements until the Stop button is pressed. When run once is selected from the Acquisition Mode list, the scope will take a single measurement when the Run button is pressed, and will then stop executing automatically.
The autoscale feature will adjust the voltage display scale based on the peak-to-peak voltage of the AC signal. Using the autoscale button is a quick way to adjust the Scale and Timebase settings to show a signal on the scope soft front panel.
The Log option allows for a captured signal to be saved to a tab-delimited text file. To save a measurement to a file, use the run and stop buttons to capture the signal you wish to save on the scope front panel. Then press the log button and name the file you wish to save.
