NI Scan Engine Performance
Overview
This document provides key considerations when analyzing the performance of CompactRIO hardware with the NI Scan Engine installed, and introduce the Real-Time Execution Trace Toolkit as a method for estimating NI Scan Engine cost in a CompactRIO system.
Contents
- Understanding NI Scan Engine Performance
- I/O Scan Thread
- I/O Variable Nodes
- CPU Usage Considerations When Using Scan Mode
- Estimating NI Scan Engine Cost For Your System
- Related Resources
Understanding NI Scan Engine Performance
NI Scan Engine performance is primarily determined by two key elements. The first element is the I/O Scan Thread: this is tied to hardware resources and is affected by the type and number of C Series Modules used, if timestamps are acquired, and other factors. The second element is the I/O Variable node. This is tied to software resources and is affected by the number of nodes in a LabVIEW VI, how nodes are accessed, and other factors. The next two sections will cover these topics in more detail.
Note: The benchmarks provided in this document (CPU and execution time) were run on a legacy CompactRIO 9012 controller. While useful to illustrate the effects of certain variables on NI Scan Engine performance, they should not be used to predict performance for newer CompactRIO controllers.
I/O Scan Thread
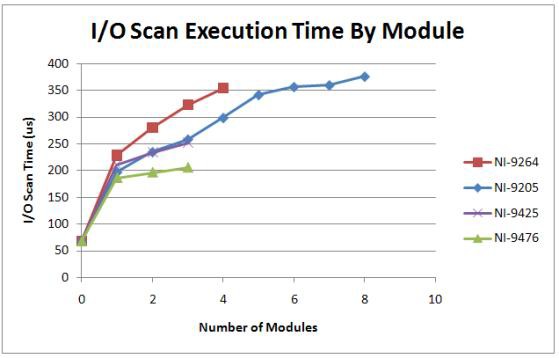
I/O Scan Time is the first major consideration when understanding NI Scan Engine performance. The main factor that controls I/O Scan execution time is the type and number of C Series Modules used in a CompactRIO system. Figure 1 compares the I/O scan execution times of a selected set of NI-RIO digital (NI-94xx) and analog (NI-92xx) I/O modules. All I/O modules, except NI-9264, used in this test support 32 I/O channels.
Figure 1. I/O Scan thread cost for different I/O module types (Above Time-Critical Priority)
Based on this data, we can make the following assumptions when trying to understand the I/O Scan time for a given hardware setup:
- Digital modules (NI-94xx) consume less I/O Scan time than analog modules (NI-92xx). This is because digital modules don’t require any scaling or calibration.
- Input-only modules for a given data type (NI-9205 voltage input module) take less time than output modules of the same data type (NI-9264 voltage output module), as there is no processing needed to write output data.
- Depending on the type and number of modules used, the total execution time of the I/O Scan thread generally ranges from 200 to 500 μs.
- Figure 1 shows ~60 μs of overhead with no I/O modules in use. This represents the fixed I/O Scan thread overhead. If you are not using any of the Scan Mode features, NI recommends that you uninstall Scan Mode software from the real-time target to avoid this fixed cost.
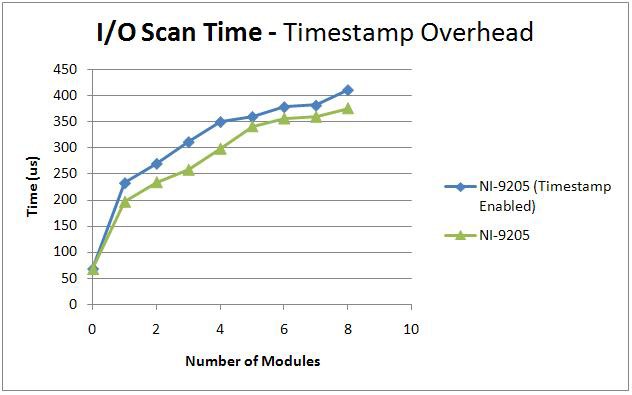
Another key element that affects the I/O Scan Time is timestamping. Each I/O variable allows you to enable or disable the timestamp feature. Enabling timestamps on any I/O variable under a module adds overhead to the I/O Scan time for that module. Figure 2 shows the difference in I/O Scan time for NI 9205 modules with and without timestamp enabled.
Figure 2. I/O Scan time for NI 9205 with timestamp feature enabled/disabled
The timestamp cost varies by module. In general, enabling timestamps can add 10-15% overhead to the I/O scan time of a given module. The timestamp feature is disabled by default.
I/O Variable Nodes
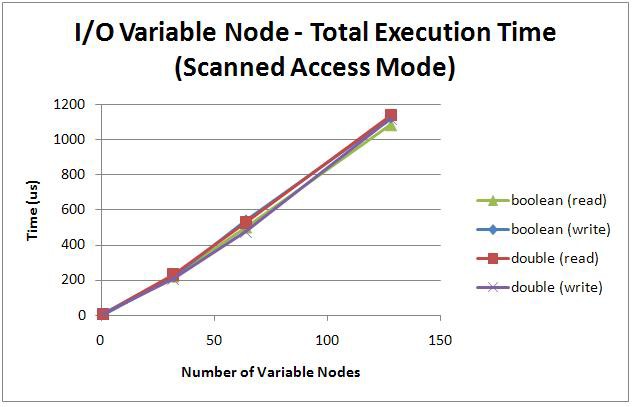
In addition to the execution time of the I/O Scan thread, each evaluation of an I/O variable node in a LabVIEW VI takes time to execute. Figure 3 shows the total execution time of Boolean and Double I/O variable nodes for both read and write operations. The trend for the total I/O variable node access time is clearly linear.
Figure 3. Total execution time of I/O Variable nodes
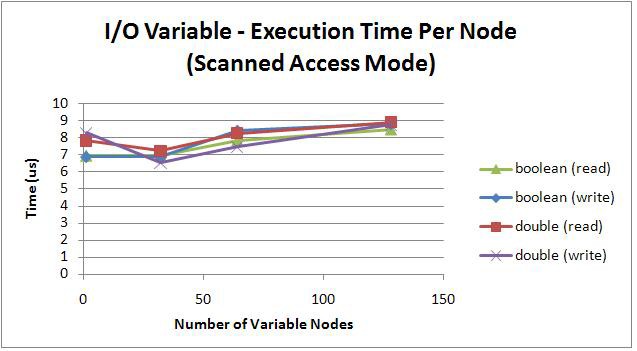
Figure 4 shows the average execution time of each I/O variable node for the same setup used to collect data for figure 3. As shown below, the execution time per node varies from 7 μs to 9 μs, with the average execution time around 8 μs. This data is an approximation of the average execution time per I/O variable node as the number of nodes on the block diagram increases. This data is based on averages collected over several thousand iterations and is adjusted to account for system jitter and benchmarking overhead. In general, 10 μs per I/O variable node is a reasonable estimate of execution time using scanned access mode.
Figure 4. Average execution time per I/O variable node
As the number of Variable Nodes increases, the execution time slightly increases.
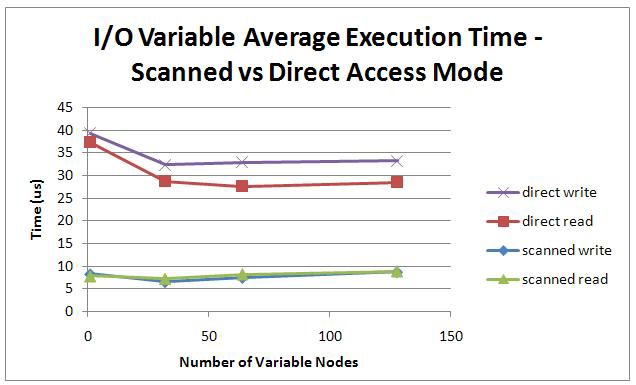
I/O variable nodes execute faster using scanned access mode than direct access mode. When you access an I/O variable using direct access mode, LabVIEW must traverse the software stack all the way down to the hardware driver, whereas scanned access simply involves accessing local memory. Figure 5 below compares scanned versus direct mode execution times for I/O variable nodes of the Double data type.
Figure 5. Average I/O variable execution time for scanned versus direct access mode
Use scanned access mode for synchronous access to a group of I/O channels. Use direct access mode to access an I/O channel asynchronously from the I/O scan. Although the execution time of direct access mode is slower than that of scanned access mode, you can take advantage of the asynchronous quality of direct access mode to access individual I/O channels at either a faster or a slower rate than the I/O scan.
CPU Usage Considerations When Using Scan Mode
CPU usage is an important metric of system performance, and certain factors can have a big impact on scan engine performance, without much application logic. Table 1 below details a simple PID loop run on a legacy CompactRIO 9012 Controller. As the number of channels used increases, the CPU usage increases. This effect is compounded as the controller's Scan Rate is increased. At 1000Hz, the CompactRIO 9012 was not able to read/write to more than 16 AI/AO pairs without reaching maximum CPU usage.
Note: More modern CompactRIO Controllers will not have this problem - these benchmarks are provided to show the effect that increasing channel counts and sample rates have on CPU usage.
| Number of Channels (AI/AO pair) | 100 Hz | 500 Hz | 1000 Hz |
| 1 | 10% | 32% | 55% |
| 16 | 16% | 47% | 95% |
| 32 | 18% | 67% | n/a |
| 64 | 27% | 96% | n/a |
| 80 | 29% | n/a | n/a |
Table 1. CPU usage for Scan Mode PID application at various scan rates
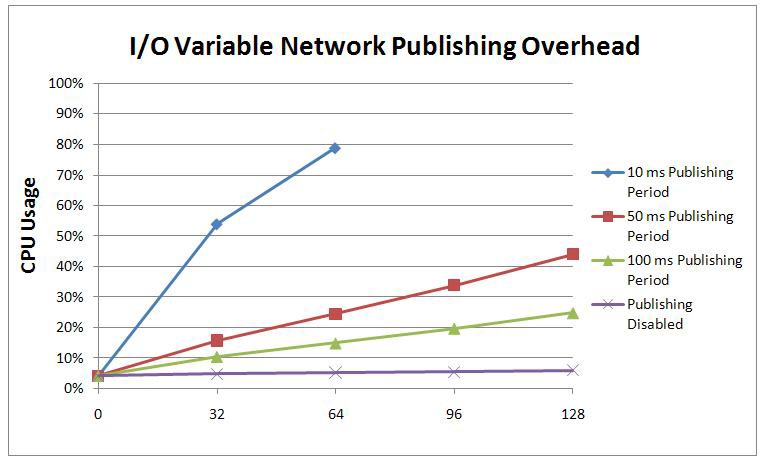
Another key factor affecting CPU usage is network publishing of data. I/O variables support network publishing for remote data access and monitoring, but using this network publishing can have significant CPU overhead, based on the publishing period selected. Figure 6 compares the system CPU usage for various network publishing rates.
Figure 6. Network publishing overhead for analog I/O variables at various publishing rates
The test setup used for the network publishing benchmarks included continuously changing analog input data from NI 9205 modules. The test used NI Distributed System Manager probes to monitor the input data on all the I/O modules and to record the total CPU usage for each scenario. The results reflect the total CPU usage with the I/O scan running at the default period of 10 ms and network publishing either disabled for all I/O variables or enabled at various network publishing rates.
Network publishing overhead is typically negligible if no remote client is connected to the target or if the I/O data is not changing quickly. But as figure 6 shows, the CPU usage can become significant when monitoring a large number of continuously changing analog I/O channels. Network publishing is enabled by default for I/O variables. However, you can disable network publishing for the individual I/O variables using the Shared Variable Properties dialog box. You also can disable network publishing for multiple I/O variables at once using the Multiple Variable Editor. The “Publishing Disabled” series in figure 6 represents the baseline CPU usage of the system with only the I/O scan running and network publishing disabled for all I/O variables.
To optimize your system’s CPU usage, you can either slow down the network publishing rate by adjusting the Network Publishing Period on the Scan Engine page of the RT Target Properties dialog box, disabling network publishing for I/O variables that you are not monitoring remotely, or making sure you don’t have a remote client connected to any I/O module unless it is using the I/O data for remote access or monitoring.
Estimating NI Scan Engine Cost For Your System
As noted in the previous sections, I/O Scan thread overhead depends on the number and type of I/O modules used in your system.
An I/O variable node itself can take around 10 μs or less of execution time. The total cost of I/O variable nodes depends on the number of nodes present in your application and the rates of the loops containing the nodes.
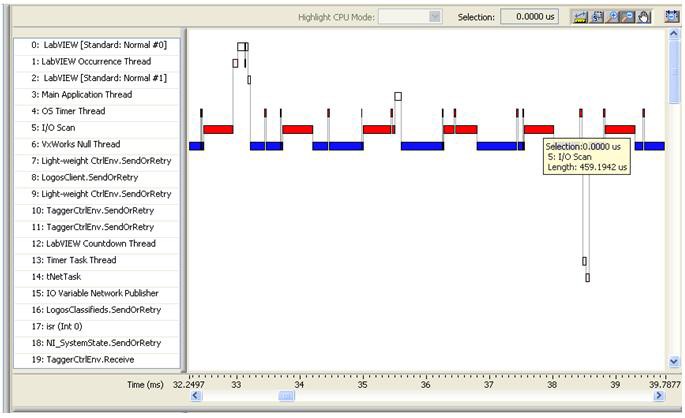
You can use the Real-Time Execution Trace Toolkit to estimate the total execution time of the I/O Scan thread for you system. See figure 7 for an example trace session showing the I/O Scan running at Above Time Critical priority. The data shown in figure 3 and figure 4 is an average of several iterations of the data collected from similar traces and is adjusted to account for system jitter and benchmarking overhead.
Figure 7. I/O Scan Execution trace for a system with eight NI-9205 modules
