Using a Digitizer for Time-Domain Measurements
Overview
Sample Rate Considerations
The sampling process converts a continuous-time signal into a discrete-time signal. Engineers are familiar with the Nyquist sampling theorem, which states that an analog signal that has been sampled can be perfectly reconstructed from the samples if the sample rate is greater than 2 times the signal bandwidth. In other words, to avoid aliasing, the signal must be perfectly band-limited to less than ½ the sample rate:
Required Sample Rate > 2 * Signal Bandwidth
Determining the signal bandwidth is simple when it comes to sine waves – this is simply the fundamental frequency – and the minimum sample rate required to perfectly reconstruct that signal would just over 2 times the fundamental frequency. However, real-world signals are often more complex. For example, from Fourier theory, we know that digital signals are comprised of a series of sine waves at odd harmonics of the fundamental. Those harmonics, which can be significant at frequencies up to 10 times the fundamental frequency, need to be considered when digitizing the signal.
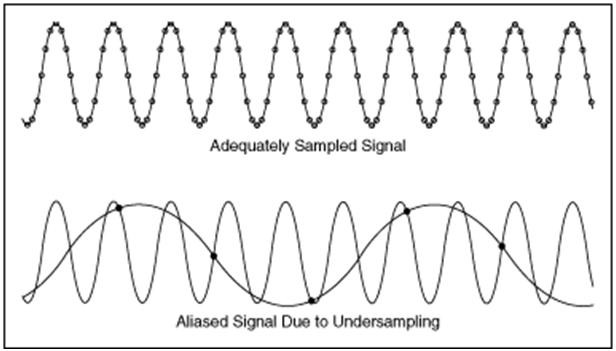
If the Nyquist theorem is violated, the high-frequency content will alias at a frequency inside the spectrum of interest (pass-band). Unfortunately, once a signal is aliased back into the spectrum, it is impossible to discriminate this aliased component from any original signal components at that same frequency. In the time-domain, the aliased signal may look much like the original signal, but signal measurements will be incorrect (Figure 1). This is why guarding against aliasing is so important.
Figure 1. An aliased signal may appear deceptively correct in the time-domain, but aliasing will result in incorrect signal measurements.
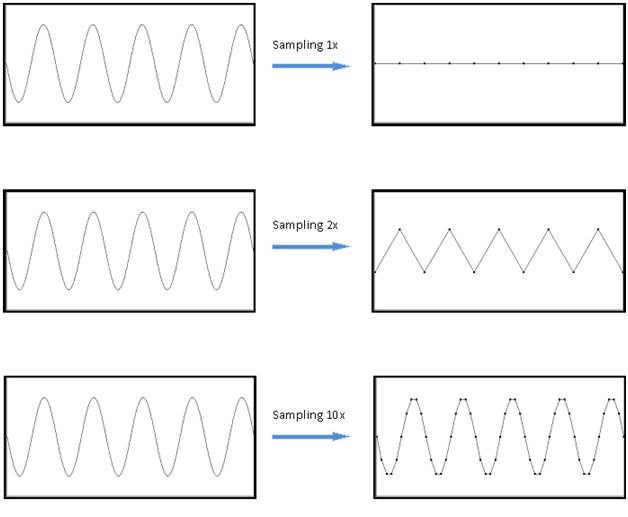
Sampling according to Nyquist will display the correct frequency information; however, without interpolation, we will have to sample at much higher rate to accurately show shape and amplitude in the time domain (Figure 2).
Figure 2. Examples of sampling at 1x, 2x, and 10x of signal bandwidth. Notice that 2x only shows the frequency information of the desired signal, not amplitude or shape.
From Figure 2, we can see that sampling at 1x the sine wave frequency of 100 MHz yields no information; sampling at 2x (200 MS/s) shows frequency, but not amplitude or shape; and, 10x oversampling (1 GS/s) accurately represents the time domain signal in terms of frequency, amplitude, and shape.
In summary:
- The Nyquist sampling theorem requires that for accurate signal reconstruction, a signal must be sampled at a rate greater than 2 times the bandwidth of the signal.
- Sampling at twice the signal bandwidth only preserves frequency information – amplitude and shape will not be preserved.
- For time-domain measurements, sampling at a rate at least 10x faster than the signal bandwidth accurately captures the frequency, amplitude and shape of the signal.
As described above, the Nyquist sampling theorem says a signal can be perfectly reconstructed from samples if the Nyquist criterion is met. This implies the use of a reconstruction filter—otherwise known as interpolation. We’ll discuss interpolation a little later when we examine reasons why you may need more timing resolution than what Nyquist provides.
Digitizer Bandwidth Considerations
Along with sample rate, another key digitizer specification is its front-end bandwidth. The input to all digitizers and oscilloscopes is essentially a low pass filter. Input signal frequencies below the rated bandwidth of the digitizer are passed through the front end for digitization. Ideally, signals above the rated bandwidth of the digitizer are rejected and cannot show up in the measurement. In reality, designing a perfect low-pass filter is impossible, resulting in digitizers and oscilloscopes that have front-end low-pass filter that pass through attenuated frequency components beyond the rated bandwidth of the instrument.
At the rated bandwidth of the digitizer, input signal frequencies are attenuated by 3 dB. This is because the analog bandwidth is defined as the frequency at which the digitizer’s filter response is down by 3 dB relative to DC. The -3 dB points are referred to as the half-power points.
Sine Wave:
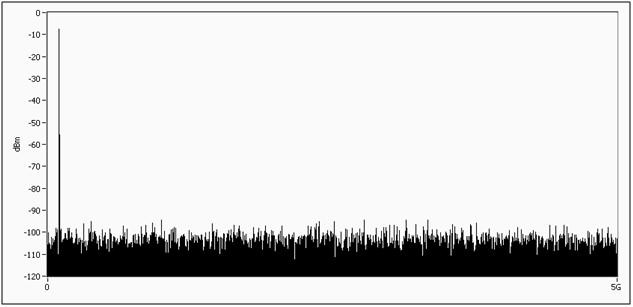
Below, we can see the frequency components of a pure sine wave at 100 MHz. The signal has a very large peak at the fundamental frequency and is essentially noise for the rest of the spectrum. This is because a sine wave is only a single tone and is a single impulse in the frequency domain. To accurately represent a sine wave in the time domain, we only need a digitizer bandwidth slightly higher than the sine wave itself.
Figure 3. Frequency components of a sine wave. Notice the large spike at the fundamental frequency.
Square Wave:
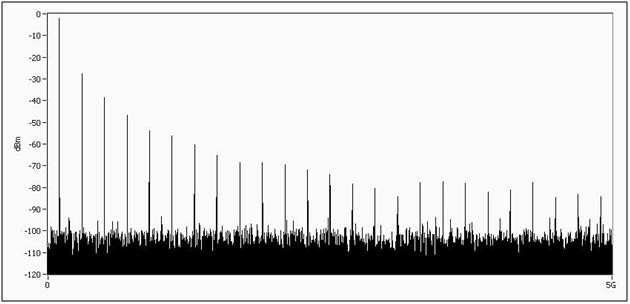
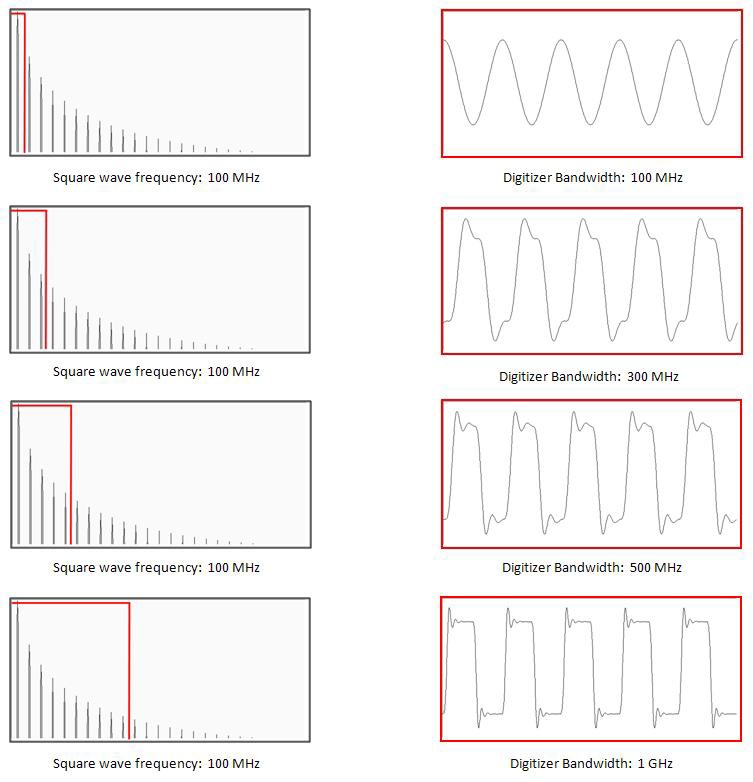
The square wave, and any other signal except a sine wave, will be composed of the fundamental tone plus some additional high frequency components. Below, we can see the frequency domain of a square wave signal. In order to properly represent our square wave in the time domain, we need a digitizer with high enough bandwidth to capture the highest frequency components of interest. In Figure 5, we can see the effects of signals measured in systems with different bandwidths.
Figure 4. Frequency spectrum of a square wave displaying a number of high frequency components.
As the digitizer bandwidth increases, not only is the digitizer better able to represent the signal shape, but the quality of signal measurement in the time domain increases as well, and measurements like rise time will be more accurate. For signals with considerable high-frequency content, such as digital signals, the first step in determining the required digitizer bandwidth is to determine the bandwidth of the signal, which can be approximated as:
For digital signals, a good rule of thumb is that the digitizer bandwidth should be 3 to 5 times greater than the signal bandwidth. For test systems that have wider measurement tolerances, lower digitizer bandwidth may be acceptable, although it is recommended that you use a digitizer with bandwidth at least two times the highest frequency component in your signal.
Figure 5. Effects of system bandwidth on the time domain representation of a square wave signal.
What is Interpolation?
Real world signals are continuous in nature; thus, even with the fastest digitizer, it would be impossible to completely sample a signal. However, through interpolation, the original signal can be reconstructed from the discrete-time samples. Although digitizers generally do not perform interpolation in hardware, interpolation can be applied in software once the raw data points have been transferred to an external PC for analysis.
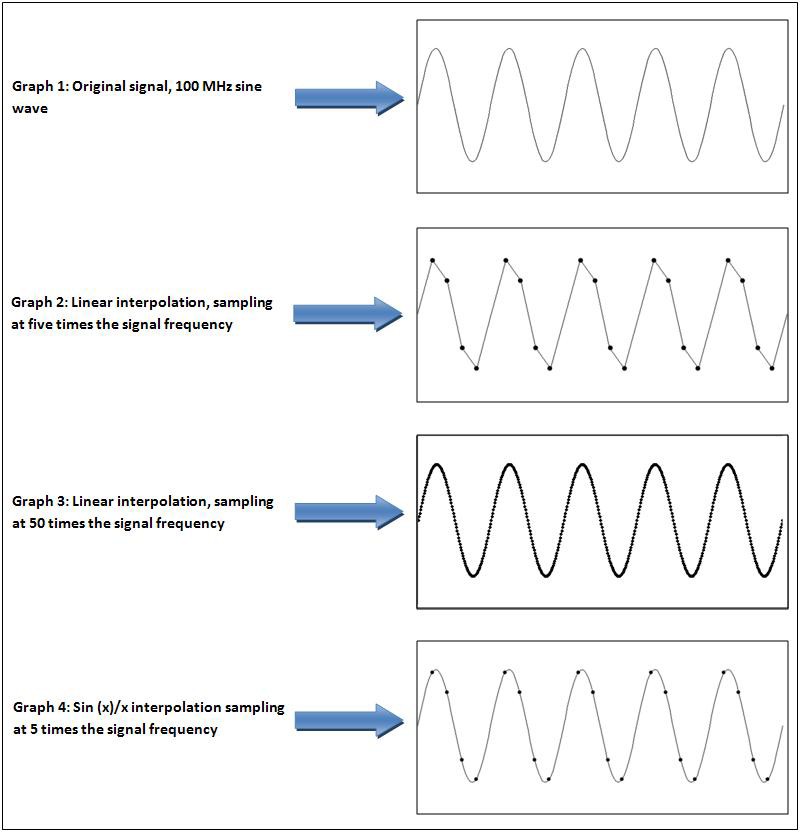
The most basic type of interpolation is linear interpolation. Linear interpolation essentially “connects the dots” between samples using straight lines. For sample rates much higher than the frequency of the input signal, linear interpolation will provide a good representation of the sampled signal (Figure 6, Graph 3). However, when sampling at lower rates, linear interpolation does not provide the best representation of the signal (Figure 6, Graph 2). For the best time domain reconstruction of a signal, modern oscilloscopes use a more robust interpolation method called sin(x)/x interpolation (Figure 6, Graph 4), which allows the oscilloscope to perfectly reconstruct the signal given that the Nyquist theorem is not violated. In fact, when using sin(x)/x interpolation, there is no benefit to sampling at rates above the Nyquist rate—after sin(x)/x interpolation, sampling at a rate 2.5 times the signal bandwidth will give the same result as sampling at a rate 10 times the signal bandwidth.
Figure 6. The dots on the graphs represent the raw samples acquired by the digitizer. Linear interpolation represents the signal well for sample rates much higher than the frequency of the signal.
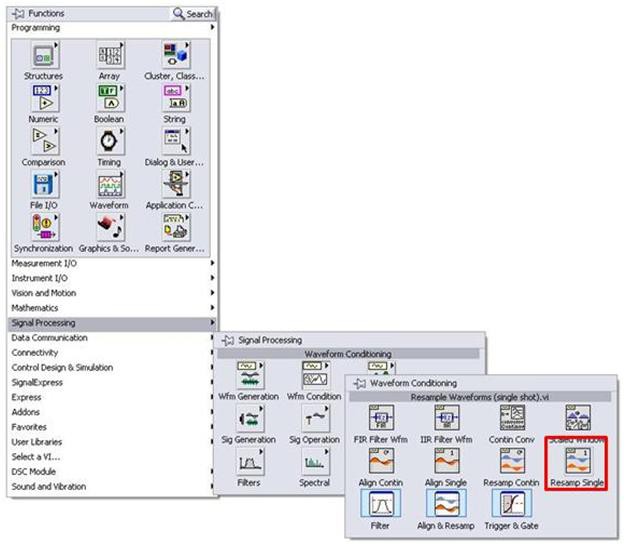
When it comes to interpolation, most oscilloscopes will do this automatically as this creates a superior waveform display compared to non-interpolated data. However, since digitizers are not display-driven, the data collected from the digitizer is not interpolated, although interpolation can be applied after-the-fact using software tools such as LabVIEW (Figure 7).
Figure 7. The Signal Processing palette in LabVIEW includes a set of Waveform Conditioning VI’s. The Resample Waveforms VI can be used to perform interpolation on a signal. Supported interpolation types include FIR (sin(x)/x), spline, linear and coerce.
